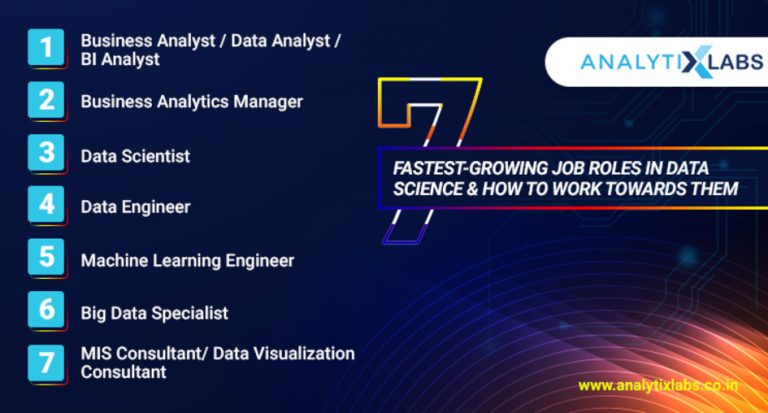
Most of the jobs that fall under the “fastest-growing” category, especially in the tech sector, did not even exist a few years ago. Job surveys increasingly hint that employers are worried about the skill gap and that employees are willing to shift to companies that offer better skill development initiative. Among the top 25 hottest skills that can get one hired is Data Visualization with Data Presentation being pegged as the key skill set. From being used to analyse information faster in a graphical format to discovering trends, even small businesses are leveraging data Visualization to recognise parameters that are correlated and find valuable insights. No matter the size of the organization, companies of all sizes are looking for data Visualization experts.
Another trend fueling the rise of data Visualization is the demand for data Visualization software globally and the emergence of powerful, self-service analytics technology that puts data into the hands of people. According to a recent market report, the global business analytics software market is expected to reach $86.5 billion by 2023. There is also a rise in demand of cloud-based business analytics software which is driving the growth in the market.
At a time when it is famously posited that organizations need broad data skills in 2019 and there’s a greater need for data communicators, data Visualization is one technical skill that can set you up for a successful career in 2019 and beyond.
Quick Facts About Career In Data Visualization
In demand: As data Visualization brings the power of big data into the mainstream, it also acts as a bridge between technical and non-technical roles, enabling more professionals to move into these data-driven roles. Another reason why it is in demand because all type of organizations require data communicators who can use data to visualize and convey results effectively to both technical and non-technical people. An idiom says “A picture is worth a thousand words”.
Average Salary: The average base pay of data Visualization specialist in India is up to ₹13.5 lakh, according to our latest study. QlikView professionals command relatively more money than Tableau professionals, whereas Tableau has maximum number of job openings.
Crucial skill in Data Science: One important thing, which people tend to miss is that Data Visualization skill is a wise investment for aspiring Data Scientists as well. A data scientist often needs to visualize data to understand complex relationships and data distribution. Data Visualization tools also help to convert complex results from projects to a format that will be easy to comprehend. The thing is, a lot of business leaders do not understand statistical terms or output from Machine Learning models. Data Scientists must help them understand visually what those terms represent and their business implications.
How To Start Learning Data Visualization
AnalytixLab’s Business Analytics 360 is aimed at beginners who need to upskill the basics of Excel, SQL, Tableau and then move onto advanced tools such as SAS, Python and machine learning. The course covers basic statistical concepts, advanced analytics and predictive modelling techniques along with in-demand tools such as Excel, Tableau, Python and SAS. The course offers the best combination of theory and tools and is led by the industry’s leading instructors. The certification course is geared at a broad range of candidates who want to pivot to the data science field and start their career as business analyst.
What The Course Covers
Tools: Advanced Excel, VBA, Tableau, SAS and Python
Theory: A blend of tools and theory, the course covers basic statistical concepts, advanced analytics, predictive modelling techniques
Why This Course
Billed as one of the most extensive Data Science courses, and offered in Bengaluru and Delhi NCR region, it is the industry’s premier job-oriented course tailored for candidates who don’t have a background in data analytics tool or Business Intelligence. Moreover, the course is offered in two formats – live online training and self-paced video format, enabling learners to finish at their pace. It is open to a broad range of candidates from varying quantitative background like Finance, Engineering, Business Management and Math who want to kick-start their career in data science and analytics.
Also, it is led by the industry’s leading instructors like Chandra Mouli, Manuj, Arun Pawar and Kaushik among others who bring in decades of analytics experience and teach business analytics and data Visualization skills in a real-world business context. The course delivers both the fundamentals and business-specific applications thoroughly. It’s the first course which evolved from the Business Analytics + SAS training, the most on-demand course and is completely geared for beginners to get them started in data science and analytics field. While there is no clear best data Visualization course yet, Business Analytics 360 covers the fundamentals, from Excel, VBA to Tableau and SQL, thereby helping learners pick up in-demand skills to launch their career effectively.
Course Facts
Course Name: Business Analytics 360
Platform: AnalytixLabs
Course URL: To know more about the course, click here
Skill level: Beginner
Instructors:
Duration: 415 hours
Classes: 50
Learning Mode: Live or Video based
For upcoming batch schedule in Gurgaon and Bangalore, please click here.