

Data visualization gives many insights that data alone cannot. Python has some of the most interactive data visualisation tools. The most basic plot types are shared between multiple libraries, but others are only available in certain libraries.
Data journalist and information designer, David McCandless, talking about the significance of data visualization in his TED talk had said, “By visualizing information, we turn it into a landscape that you can explore with your eyes, a sort of information map. And when you’re lost in information, an information map is kind of useful.” Here are the top 5 visualisation libraries of Python.
Top Python Libraries for Data Visualization
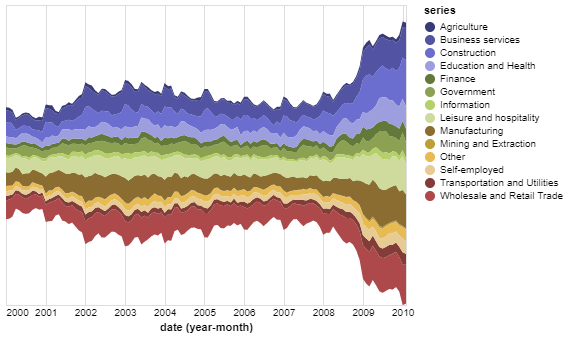
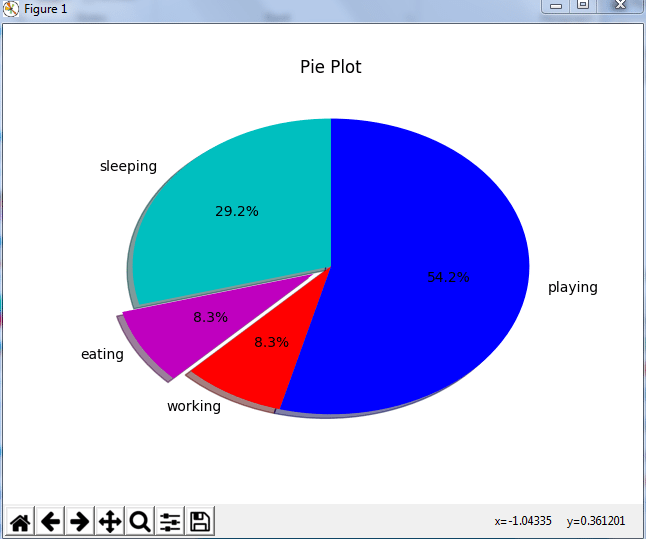
1. Matplotlib
Matplotlib is the most popular data visualization library of Python and is a 2D plotting library. It is the most widely-used library for plotting in the Python community and is more than a decade old. It comes with an interactive environment across platforms. Matplotlib can be used in Python scripts, the Python and IPython shells, the Jupyter notebook, web application servers and four graphical user interface toolkits. It is a very versatile visualization library. With this library, with just a few lines of code, one can generate plots, bar charts, histograms, power spectra, stemplots, scatterplots, error charts, pie charts and many other types. The pyplot module provides a MATLAB-like interface, particularly when combined with IPython. Matplotlib predates HTML5’s support for rich web applications, focusing instead on static images for publication along with interactive figures using desktop-GUI toolkits like Qt and GTK.
2. Plotly
Plotly is a web-based toolkit to form data visualisations. Plotly can also be accessed from a Python Notebook and has a great API. With unique functionalities such as contour plots, dendrograms, and 3D charts, it has visualizations like scatter plots, line charts, bar charts, error bars, box plots, histograms, multiple axes, subplots and many others. It contains a great API including one for Python. It also has contour plots, something which is not very common in other libraries.

3. Seaborn
The Python data visualization library of Seaborn is a library based on Matplotlib. It provides a much more terse API for creating KDE-based visualizations. It provides a high-level interface for drawing attractive and informative statistical graphics. It is tightly integrated with PyData stack, including support for numpy and pandas data structures. Seaborn aims to make visualization a central part of exploring and understanding data. Its dataset-oriented plotting functions operate on data frames and arrays containing whole datasets and internally perform the necessary semantic mapping and statistical aggregation to produce informative plots.

4. ggplot
Ggplot is a Python implementation of the Grammar of Graphics of R programming language. It is a system for declaratively creating graphics, based on the Grammar of Graphics and is tightly integrated with Pandas. Once it is told how to map the variables to aesthetics and what primitives to use, it takes care of all the details. Ggplot’s method is not designed for creating highly customised graphics.

5. Altair
The Python library of Altair is a declarative statistical visualization library and has a simple API, is friendly and consistent and built on top of the powerful Vega-Lite visualization grammar. A declarative library needs one to only mention the links between the data columns to the encoding channels and the rest plotting is handled automatically. This elegant simplicity produces beautiful and effective visualizations with a minimal amount of code. The source of Altair is available on GitHub. It is easy to design effective and beautiful visualizations with a minimal amount of code using Altair.