


Graph Theory is one of the key subjects essential in mastering data science. This area of mathematics helps understand data in a clear and concise manner. In fact tech giants like Google, Facebook and eBay use graph theory extensively in their business for the same.
Apart from knowing graph theory, it is necessary that one is not only able to create graphs but understand and analyse them. Graph theory software makes this job much easier. There are plenty of tools available to assist a detailed analysis. Here we list down the top 10 software for graph theory popular among the tech folks. They are presented in a random order and are available on major operating systems like Windows, MacOS and Linux.
1. Tikz And PGF

A popular software in the scientific research community, Tikz and PGF are two separate software packages in one offering. They are based on the typesetting language TeX. Both Tikz and PGF are used to create vector-style graphics. While Tikz focuses on creating complex, PGF is for designing simpler visual diagrams. Any expert in graph theory will breeze through these by making wonderful analysis with this software.
You can download it here.
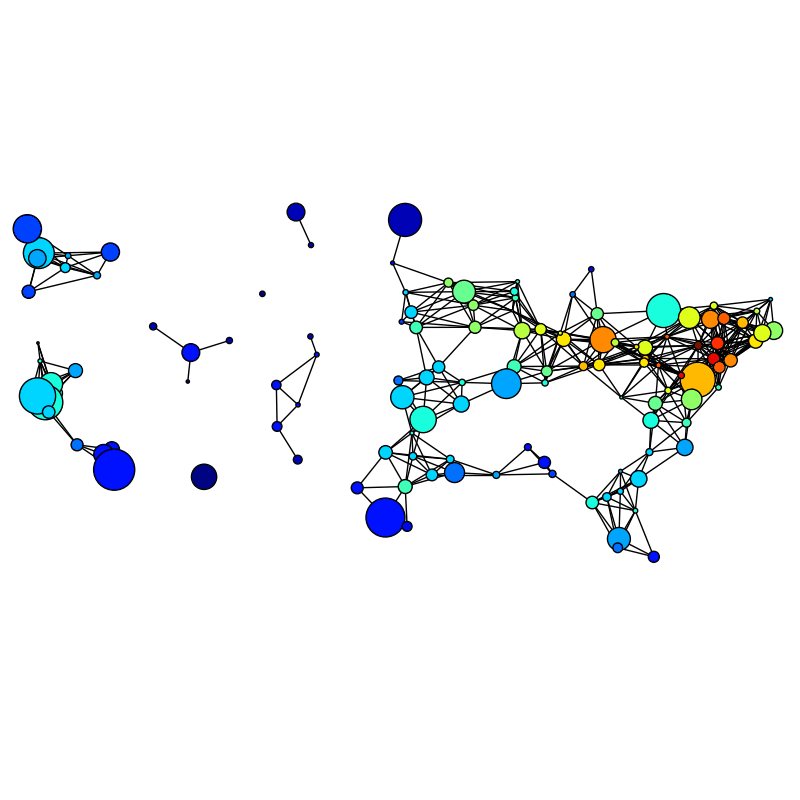
2. Gephi
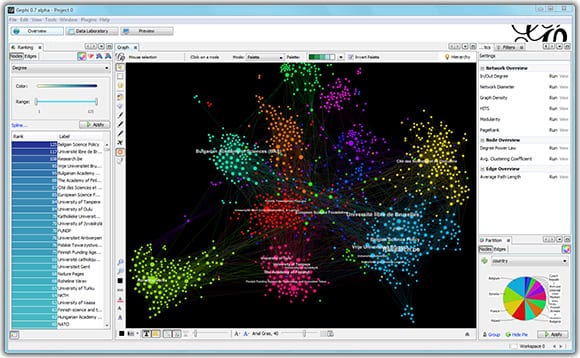
Gephi is another free to download software exclusively developed for data analysis. Hinging mainly on network visualisation and data exploration, this tool uses a 3D render engine for creating complex graphs. It is primarily written in Java and is available for Windows, MacOS and Linux platforms. Gephi is currently maintained and improved by The Gephi Consortium.
You can download Gephi here.
3. NetworkX
Nothing beats the classic Python way of doing things. So, data scientists should be grateful for NetworkX, a Python library that is solely relied on for graphs and networks. Just like the previous two, this library also offers multiple features like network dynamics and data format support. NetworkX also has provisions like fast prototyping and is easy to understand.
You can download this Python library here.
4. LaTeXDraw

LaTeX, which is a popular document preparation/typesetting system, has an additional graphics editor called LaTeXDraw. This editing tool is built using Java. LaTeXDraw relies on PSTricks, a type of macros present in LaTeX for enabling various shapes required to draw graphical representations. It also has text rendering which makes it an attractive tool among LaTeX users.
You can download LaTeXDraw here.
5. Sage
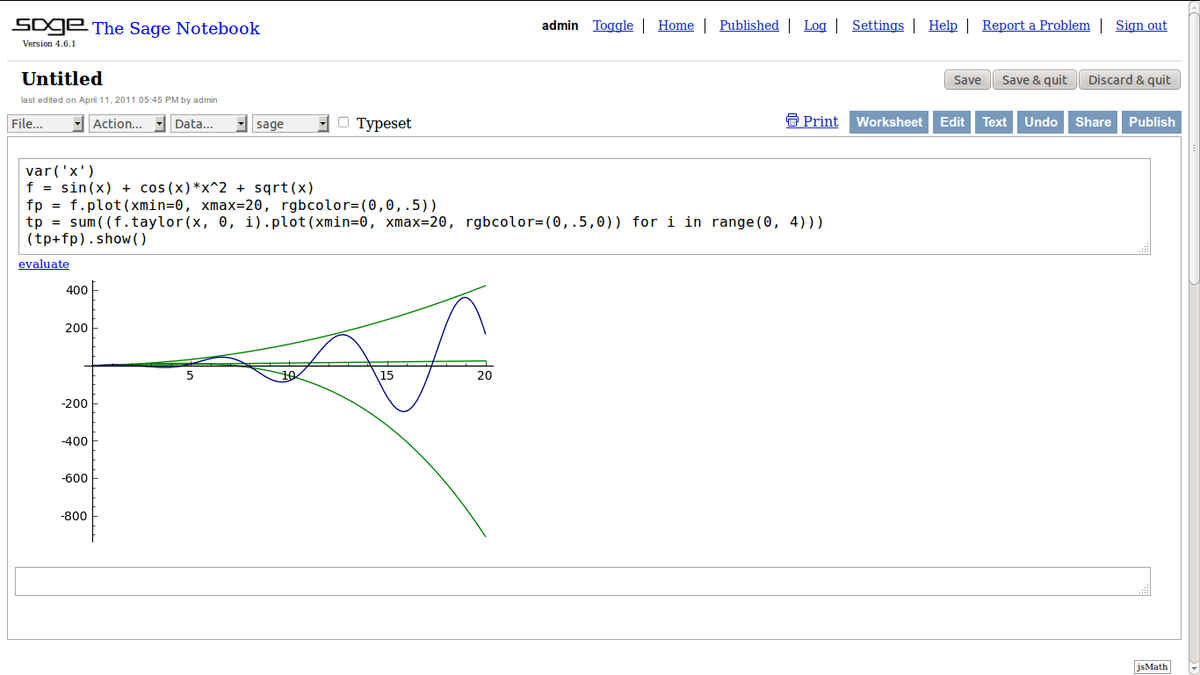
A mathematics software, Sage is a free open-source tool that packs impressive mathematical functionalities inside (like MATLAB). Derived from principles followed in multiple math software projects, Sage is used for outlining graphs as well as hypergraphs. Simple or outright concrete, Sage has a mathematical approach for creating graphs and is popular in the academic communities across the world.
You can download Sage here.
6. MATLAB

One just cannot ignore this powerful mathematical software if working on graph theory. Just like other software listed here, MATLAB packs a punch in creating standard graphs too. Its Bioinformatics Toolbox has plenty of data visualisation and exploration elements in addition to graph theory functions. MATLAB is really helpful when using graph theory for a large real-time project. Unfortunately, MATLAB is not free to use and comes with a paid subscription.
You can download the trial version here.
7. Inkscape
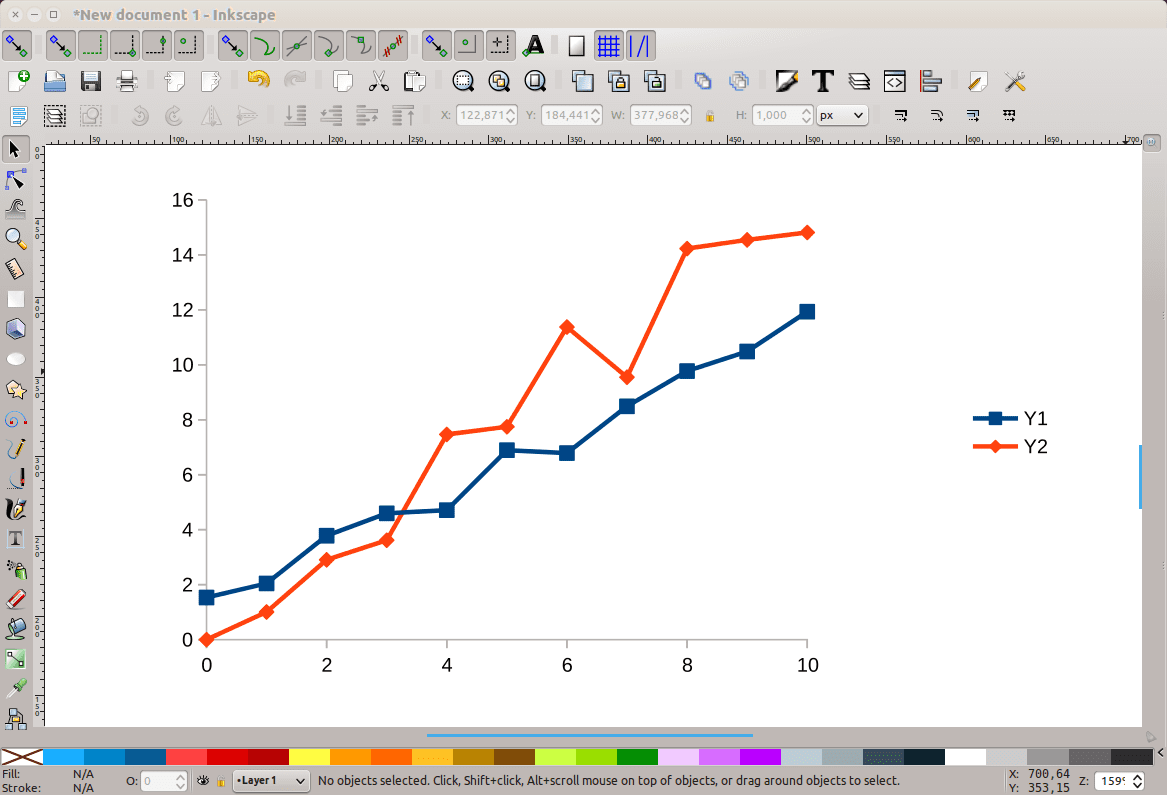
A free and open-source offering, Inkscape is again a vector-style graphics creating software. It can be used to create graphs, charts and many more diagrams. Although this is mainly for graphic designers, its ease of use and customisation is what makes it a favourite choice for technical users.
Inkscape can be downloaded here.
8. GraphViz

A pure visualisation software, GraphViz provides a plethora of graphical options to use in graph theory. Its immersive layout takes graphical text descriptions as input and creates diagrams of the desired choice. On top of this, it also offers various customisation elements. Diagrams created from GraphViz can also be relayed on a browser.
Download GraphViz here.
9. NodeXL

NodeXl is an open-source Microsoft Excel template devoted solely for network graphs. What’s unique here is the Excel-like environment when working with graphs. In brief, all one has to do is to enter a network edge list in a spreadsheet and with a click of a button, a graph is created. The paid versions of this software provide additional functionalities such as social network analysis, task automation and so on, with tech support.
You can install the free version of the template on MS Excel here.
10. MetaPost
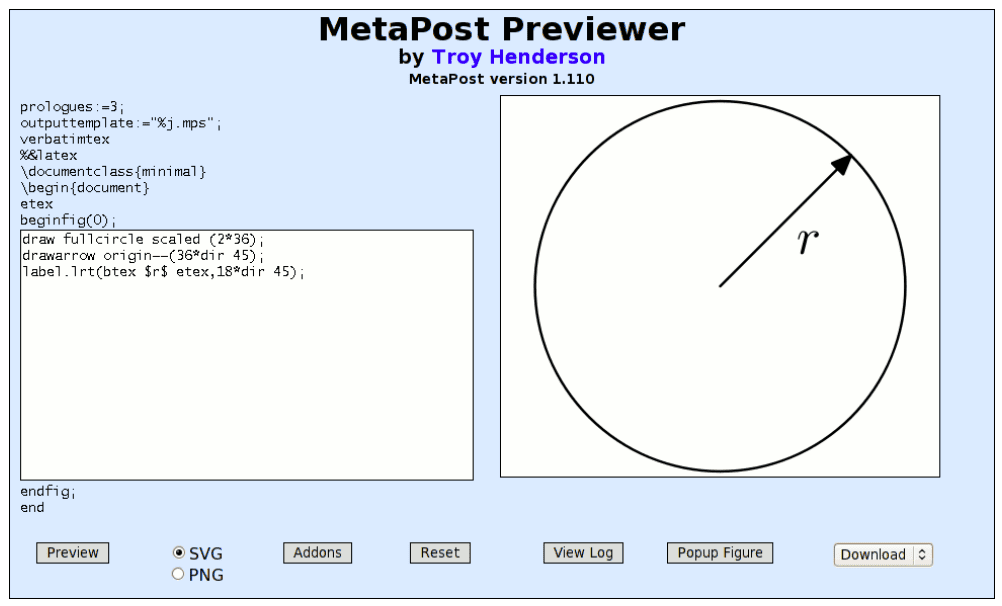
The term ‘MetaPost’ refers to both a programming language as well as an interpreter program. It also works on producing vector graphic files. Just like LaTeXDraw, MetaPost has a provision for implementing macros to produce graph theory features. In fact, it can also interact with other typesetting languages like TeX or troff. Hence, MetaPost is quite popular among researchers. Nonetheless, it is also suitable for graph theory.
MetaPost can be downloaded from TeX Live and MiKTeX, two binaries that provide the MetaPost environment.