Most machine learning problems boil down to fitting a set of observations(points) to some mathematical curve (simplistically referred to as the “model” in machine learning parlance). That yields a compressed representation that can be used for applications including prediction and pattern recognition.

The process of fitting typically involves minimising what is called the cost function that is representative of the error in the chosen curve with respect to the observed samples that it attempts to fit. In this article, we will delve deeper into the intriguing world of cost functions, how their choices play a big role in the selection of the model and finally see some mind boggling deeper connections to real world governance models (which will be interesting what with elections in the air!). In this article, we will use the simplest curve fitting problem — linear regression in our journey of understanding these cost functions.
Linear Regression
Suppose you have a bunch of features for a particular problem (say n = 100). And you know that the output that you are trying to predict is a linear combination of these features. The classical use case that most tutorials talk of is predicting the price of a house based on various features (xⱼ) of a house, where features range from location to roof types to area et al. The prediction of the price (y), represented by the function h(x) would look as follows:

where xⱼ = featureⱼ, Wⱼ= value of featureⱼ and W₀= biasing constant

Predicting the price of a house
The Cost Function
Suppose I have a training data of m=2000 data points. We need to find values for W such that the price predicted is as close to the actual price as possible.
In other words what values should W take such that the following cost is minimised.

where x(i) and y(i) correspond to the with sample
Note that we are trying to measure the absolute error in prediction (as shown in the figure) for every sample and are taking the average.

However the most popular cost function used in most literature (and practically too) is the following:

wherein the average of the square of the error in every sample is taken. Note the difference between the two cost functions is the power to which the absolute error is raised. Therefore the square error function is referred to as the L₂-norm while the former function is referred to as the L₁ norm.
Cost Minimisation
Now the million dollar question: Why is L₂-norm more popular than the L₁ norm? Most of the literature points to a pre-computer period reasoning on the method of calculation as explained below.
For the cost minimization problem, any preliminary textbook on calculus would tell us that the first order derivative at that minimum point would be zero. Simply put, the solution to the problem would lie at the points that meet the following criteria.
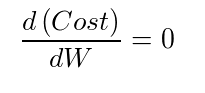

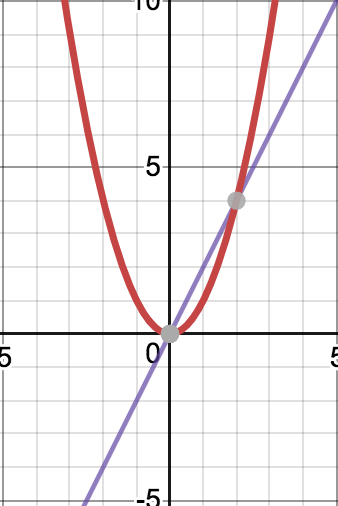
It turns out that a closed form solution — a simple formula in simple words — is not possible when the cost function is absolute error as opposed to when the cost function is the sum of square errors. The reason is that the cost function is not differentiable at the point (Cost = 0) as can be seen in the graph below. The violet line that represents the derivative is discontinuous at the point Cost = 0

The cost function that uses the square error is completely differentiable as can be seen from the figure below.
The closed form solution in fact turns out to be the following equation:
![]()
where X is the matrix of feature values where Xᵢ,ⱼ represents the value of featureⱼ in sampleᵢ.
However in the age of computers, algorithms like gradient descent can be applied and the solution iteratively derived. I am not going to delve into the details of gradient descent but want to note that gradient descent can still be used for the L₁-norm as long as the differentiation of the cost function at zero is taken to be zero. Alternately methods such as sub-gradient could also be used. So is there still reason to use the L₂ norm and is it worthy of its popularity? We shall see that in a moment.
Lp-norm
Now that we have looked into 2 costs functions — L₁ norm and L₂ norm, lets try to generalize this to Lp-norm, where p can be a positive real number.

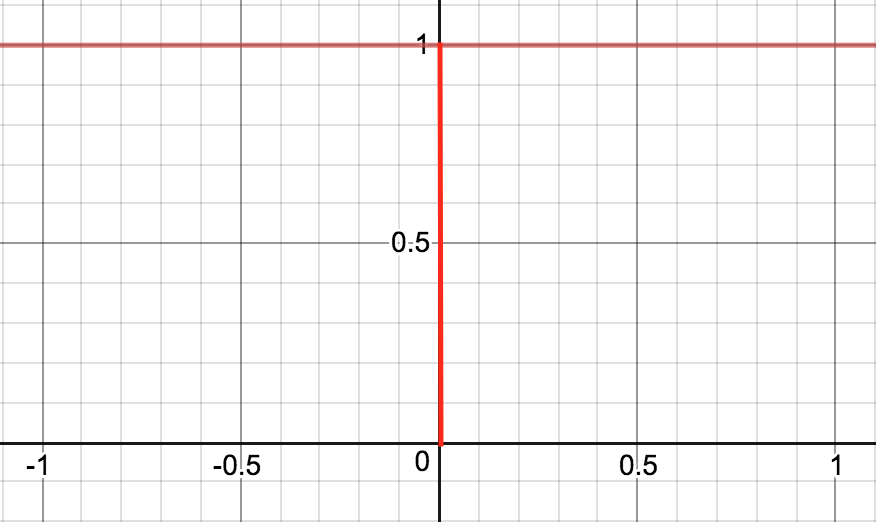
So what would L₀-norm mean?

This means that if the absolute deviation at a particular point is zero, error is zero, else the error is 1. Imagine for a moment the chances of that in a continuous space – that would be zilch.
If the L₀-norm is used in the context of linear regression the cost would be the total number of points that do not lie on the line of fit. This means that the use of L₀-norm would try to find the line that exactly passes through the maximum number of points.
Understanding Cost Functions With An Example
So I took an example to understand the three cost functions better. Suppose I want to do a linear regression on the points shown in the figure below.

I know that this is not really a good example to apply linear regression since the points seem to be scattered into 3 blocks. There is some sort of a line at the top block, a small set of collinear points in the middle and a bunch of points randomly distributed around zero in the rightmost block. However I am going to use linear regression to illustrate the behaviours of the cost function. Also please assume that none of these points are noise or outliers.
At this juncture, it is also important to call out that gradient descent algorithm cannot be applied on L₀-norm due to the discontinuous nature of the function at zero (impulse drop where its value is zero!) and also the flat nature (plateau) elsewhere as shown in the graph below.
However there are algorithms such as matching pursuit that allows us to solve for L₀-norm cost functions too.
The Cost Functions Rule Our World
Now let us look at the curves fitted by the three cost functions.

As can be seen the L₁ norm passes through the topmost block of points, while L₀-norm passes through the small set of collinear points in the middle and the L₂ norm cutting through the middle of the graph. I think this is quite intriguing and we shall see why in the ensuing paragraphs.

The L₂ norm attempts to cater to every observed sample — while at first sight it might look to be overfitting, the cost function is actually trying to be “inclusive” and “accommodating” and placing the line in the position where it can be as approachable as possible to every point.

The L₁ norm, on the other hand, passes through the major block of seemingly points sampled around a line. The L₁ norm cost function has virtually ignored the middle and the rightmost block. In essence L₁ norm is more of a majoritarian function catering to the biggest block in the observed sample set.

The L₀-norm passes through a smaller set of collinear points. It is a cost function that is almost an embodiment of “my (our) way or highway”. It does not tolerate even the slightest deviation — so it virtually ignored almost all the samples presented and just went for the truly linear points in the sample. It is almost an “oligarchy” at play, where a small set of perfectly aligned observations dictate the model. Think about this for a moment — in a truly continuous space and in cases of a linear relationship but not perfectly linear, the probability of three points being collinear is as good as zero that the line selected may pass through only two points — it would be almost like two individual points just run the show.
The Winner
So generalizing it, in Lp-norm cost functions, as p decreases, we can see the model transformations into majoritarianism and finally oligarchy! However higher order cost functions of Lp norm promote inclusivity! That I think explains the popularity behind the choice of the L₂ norm function. Choice of the cost function depends on the scenario, but for most data sets, fair to say that L₂ norm function works.
In the next article, I shall cover the topic of overfitting which is addressed by a technique called Regularisation.