


If one can make an effort to look at the night sky and spot the Virgo constellation, then they have succeeded in approximating the location of Messier 87(M87) galaxy which houses the famous supermassive blackhole “Powehi”.
After many years of collecting data and many simulations of the would-be blackhole, the researchers have finally released the image of a blackhole which not only proves its existence but also verifies Einstein’s general theory of relativity. We are only 2 decades into the 21st century and have already witnessed the existence of gravitational waves and blackholes.
It is also equally exciting to know about the work that led to this momentous achievement.
The final picture of the blackhole might be very alluring to the eye but the researchers had to put in a lot of hours writing a lot of code to devour over the tonnes of data being generated by the telescopes all around the globe.
The light coming from the vicinity of the blackhole is 55 million light years away and the field of view for the telescopes on earth is reduced to an infinitesimal angle; not to forget the immense gravitational pull of the blackhole on light. And, within this tiny available window, the data generated was equal to half a tonne of hard drives and took more than a year and many flights to move the data to get it stitched.

The imaging algorithms are the backbone of this project along with the funding of course. To run the datasets on these algorithms, the researchers primarily used Python. From arraying the data to plotting it for meaningful insights, Python offers a variety of libraries like pandas or matplotlib.
For instance, the custom (Astronomical Image Processing System)AIPS pipeline is an automated Python-based script using functions implemented in the eat package. A suite of diagnostic plots, using tasks VPLOT and POSSM, are also generated at each calibration step within the pipeline.
The CASA and AIPS data sets are used for validation, including direct data cross-comparisons as well as validation of downstream analysis results. Each data product is provided in UVFITS format. The choice of format was motivated by the need for common output across all pipelines,and easy loading, inspection, and imaging in all software used in the downstream analysis efforts and via readily available Python modules.
Here are the famous Python libraries that went in to the code behind the calibration and correction of the data collected by the telescopes:
- Numpy (van der Walt et al. 2011)
- Scipy (Jones et al. 2001)
- Pandas (McKinney 2010)
- Matplotlib (Hunter 2007).
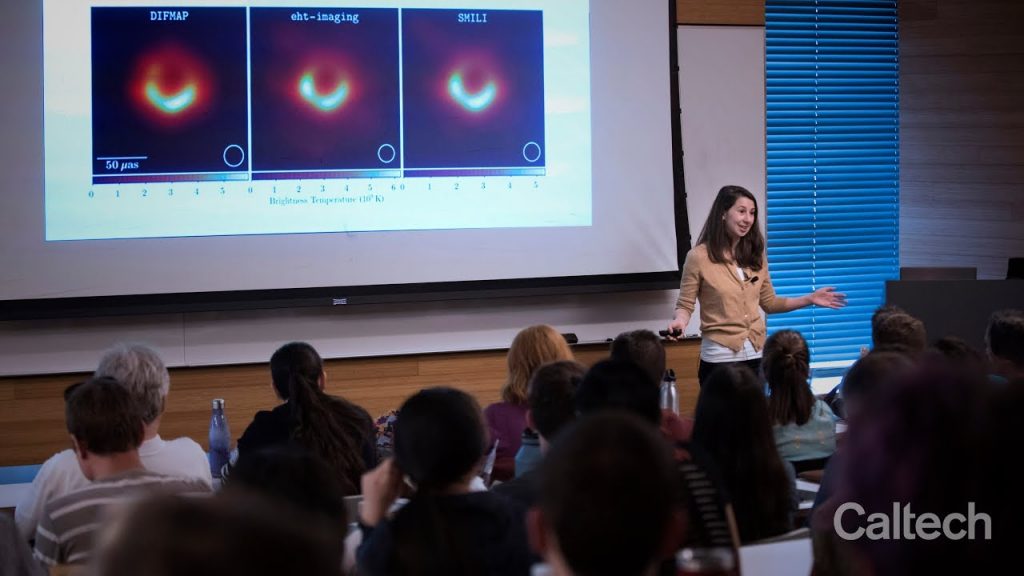
Along with the pre existing Python modules and libraries, one of the researchers Andrew Chael also used Python to create the framework ehtim(eht-imaging), customised for black hole imaging project.
This was used for implementing regularized maximum likelihood imaging methods on Event Horizon Telescope(EHT) data. In the last two years, it has evolved into a flexible environment for manipulating, simulating, analyzing, and imaging interferometric data and is a workhorse of the EHT’s data analysis pipeline.
The package contains several primary classes for loading, simulating, and manipulating (Very-long-baseline interferometry)VLBI data.
Reconstructing an image using VLBI measurements is an ill-posed problem, and as such each there are an infinite number of possible images that explain the data. The challenge is to find an explanation that respects these prior assumptions while still satisfying the observed data.
The main classes are the Image, Array, and Obsdata, which provide tools for manipulating images, simulating interferometric data from images, and plotting and analyzing these data. Movie and Vex provide tools for producing time-variable simulated data and observing with real VLBI tracks from .vex files. imager is a generic imager class that can produce images from data sets in various polarizations using various data terms and regularizers.
Let’s take a look at few snippets of Python code used:
For calibration:
import sysimport os
import argparse
import numpy as np
import ehtim as eh
import matplotlib.pyplot as plt
# Skipping calibration in the absence of specified sites
for i in range(n):
# network calibrate the amplitudes
datadir = outdir + ‘{}-{}-amp’.format(stepname, i)
caltab = eh.network_cal(pick(obs,sites), amp0, method=’amp’, pol=’RRLL’, **common)
caltab = caltab.pad_scans()
obs = caltab.applycal(obs, interp=’nearest’, extrapolate=True)
caltab.save_txt(obs, datadir=datadir)
obs_cal_avg.save_uvfits(datadir+’/’+args.output)
if master_caltab == None:
master_caltab = caltab
else:
master_caltab = master_caltab.merge(caltab)
For imaging:
import osimport matplotlib.pyplot as plt
import numpy as np
import ehtim as eh
# load the uvfits file
obs = eh.obsdata.load_uvfits(datafolder + name + '.uvfits')
# Helper function to repeat imaging with and without blurring to assure good convergence
def converge(major=5):
for repeat in range(major):
imgr.init_next = imgr.out_last().blur_circ(res)
imgr.make_image_I(show_updates=False)
# saving the gain plots using NumPy
ct = eh.selfcal(obs, im2, method=’both’, ttype=’nfft’, processes=0, caltable=True)
ct.plot_gains(list(np.sort(list(ct.data.keys()))), yscale=’log’, export_pdf= pathtooutput + SCRIPTNAME + tag + ‘_gains.pdf’)
Check the full Python code here
Check the documentation for ehtim framework here
Read more about EHT Imaging here