


Visualising the behaviour of neural networks has been of great interest lately for two reasons — to have a glimpse at how intelligence in its fundamental appears and to analyse the neurons for improvement (avoiding misclassification etc.) of the network.
Previously, AI researchers started with individual neurons. In this method, a noisy image is added with details gradually until a noticeable excitement in that neuron can be observed. But this method doesn’t show how neurons interact with each other.
Google in collaboration with OpenAI, came up with a better approach- Activation Atlases, which is a new technique aimed at visualising how neural networks interact with each other and how they mature with information along with the depth of layers. Their work was published as a paper titled “Exploring Neural Networks with Activation Atlases”.
Previous works showed how activations happen in one image but Activation Atlases will enable the users to visualize the activation in 1 million images.
Activation atlases are developed to have a look at the inner workings of convolutional vision networks and derive human-interpretable overview of concepts within the hidden layers of a network.
A Sneak Peak Into The Network
Every object has a certain amount of detail, which we humans subconsciously identify. The neural networks on the other hand only receive a 2D image of this object. Activation atlases help visualise how these neural networks use visual detectors to classify images, such as textures of wood, fruits or floor, patterns in petals of a flower or that of a honeycomb.
Activation atlases function as follows:
- Randomly select one spatial activation per image
- Use Algorithms, such as t-SNE and UMAP to project high-dimensional data of activation vectors into useful 2D layouts
- For each cell in the grid, average all the activations that lie within the boundaries of that cell
- For each activation vector, compute an attribution vector
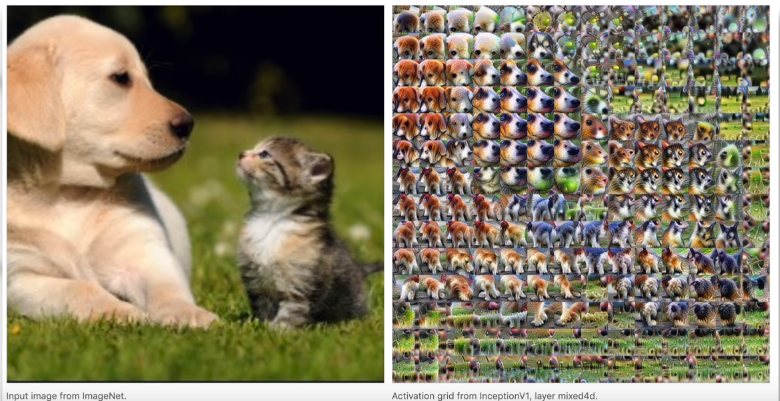
The above picture gives an overview of how the activations can be mapped on dense samples. On the left is a randomized set of 1 million images fed through the network.
The centre part depicts how the activations are fed through UMAP to reduce them to two dimensions. UMAP (Uniform Manifold Approximation and Projection) is a dimension reduction technique that can be used for visualisation similarly to t-SNE, but also for general nonlinear dimension reduction.
These activations are then plotted, with similar activations placed near each other. Then a grid is drawn consisting of the average of the activations that fall within a cell. Eventually, a feature inversion is performed on these activations as shown on the right.
This example is an illustration of classifying a ‘cabbage’
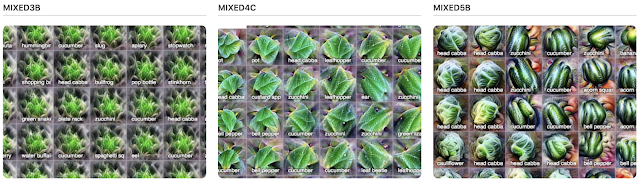
- Left: This layer has very nonspecific information
- Center: Here, the images resemble leaves, but they can belong to any plant.
- Right: The final layer consists of properties specific to a cabbage.
These atlases not only help visualise the abstract hidden ideas in an image but can also reveal how a neural network can misclassify a certain image.
For example, activation atlas for a “great white shark” and a baseball with red stitching shows how the neural network mistakes the stitchings for the mouth of the shark.

Tools like activation atlases could show the semantics of the data and not just visual similarities, like showing histograms of common pixel values.
Where Can Activation Atlases Improve
- Neural network activations have an underlying compositional, combinatorial structure. Activation Atlases solve this problem by sampling the interesting activation vectors but completely lose the original compositional structure
- Activations atlases are computationally expensive
- Since Activations atlases are based on dimensionality reduction, the final output can be sensitive to the hyperparameters chosen for the reduction step
Know more about activation atlases here