ML models are deployed for something as trivial as purchasing a toothbrush or to gravely significant applications like cancer detection or for safety of nuclear plants. Whatever be the application, the foundations of an ML model are rooted in mathematics-dot products, partial differentiation, network topology etc.
Since the ground truth is very well known, few techniques can be devised to keep an eye on how these models behave in their finality.
The following are few traditionally used methodologies to evaluate the performance of a machine learning model:
With The Use Of Loss Functions
To keep a check on how accurate the solution is, loss functions are used. These functions are a handful of mathematical expressions whose results depicts by how much the algorithm has missed the target. An example would be that of a self driving car whose on board camera, if, misidentifies a cyclist as lane marks then that would be a bad day for the cyclist. Loss functions help avoid these kind of misses by mitigating the errors.
For a classification problem, hinge loss and logistic loss are almost equal for a given convergence rate and are better than square loss rate.
Squared loss function which operates statistical assumptions of mean, is more prone to outliers. It penalises the outliers intensely. This results in slower convergence rates when compared to hinge loss or cross entropy functions.
When it comes to hinge loss function, it penalises the data points lying on the wrong side of the hyperplane in a linear way. Hinge loss is not differentiable and cannot be used with methods which are differentiable like stochastic gradient descent(SGD). In this case Cross entropy(log loss) can be used. This function is convex like Hinge loss and can be minimised used SGD.
With Similarity Scores
Similarity score is designed to tackle this scenario using the training probability values associated coverage scenario and not the good training coverage scenario. In addition to a score for detecting potential drops in predictive performance, the system infrastructure must support such feedback, alert the mechanism and ideally handle the diversity of engines and languages typically used for ML applications (Spark, Python, R, etc.). a system that leverages this score to generate alerts in production deployments.
There are three pressing issues that Similarity scores aim to address:
- Low number of samples: since the Similarity score is calculated based on the parameters of the multinoulli distribution and does not rely on the inference distribution, it is agnostic of the number of samples.
- Similarity score reply on the probability values associated with this narrow range of distribution and hence does not penalize the fact that inference distribution does not cover the entire range of categories observed during training.
- The subset of patterns seen during inference might either have poor training coverage or good training coverage.
A similar approach was taken up by the engineers at ParallelM propose MLHealth, a model to monitor the change in patterns of incoming features in comparison to the ones observed during training and argue that such a change could indicate the fitness of an ML model to inference data.
Though there exists techniques such as KL-divergence, Wasserstein metric etc. that provide a score for the divergence between the two distributions, they rely on the fact that the inference distribution is available and representative of the inference data. This implies there are enough samples to form a representative distribution.
Testing For NLP Tasks
Natural Language Processing(NLP) applications have become a top priority for machine learning developers. From QA systems at Google to chatbots to speech assistants like Alexa, NLP is essential. As companies look to make AI to AGI, understanding very sophisticated human language will be under the radar for quite some time.
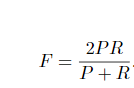
To test models implementing NLP tasks, there are techniques like F-score and BLEU score.
F-score is a measure of the test’s accuracy. The precision P and the recall R of the test are calculated. The F-score is the harmonic average of the precision and recall. Closer to 1 is considered to better and closer to 0 values indicate the inaccuracy of the model.
ML Is Not A Substitute For Crystal Ball
The typical life cycle of deployment machine learning models involves a training phase, where a typical data scientist develops a model with good predictive based on historical data. This model is put into production with the hope that it would continue to have similar predictive performance during the course of its deployment.
But there can be problems associated with the information that is deployed into the model such as:
- an incorrect model gets pushed
- incoming data is corrupted
- incoming data changes and no longer resembles datasets used during training.
Whether it is the market crash or a wrong diagnosis, the after-effects will be certainly irreversible. Tracking the development of machine learning algorithm throughout its life cycle, therefore, becomes crucial.
Know more about loss functions here
Read about BLEU score here