


 Business executives are often faced with difficult decisions which are often multi-dimensional. There are several aspects to be considered, and consumer preferences to be taken into account. Analytics experts strive to determine what factor is the most important to the consumer and hence should be given highest weight while taking the decision. To deal with such situations, a very useful statistical technique called ‘Conjoint Analysis’ is used. As the name suggests, several variables are jointly considered and tested in order to determine their overall importance.
Conjoint analysis is an advanced analytical approach that tries to determine how consumers make decisions and what they really value in products and services. Conjoint analysis involves presenting people with choices and then analysing what were the drivers for those choices.
To do this, a controlled subset of the larger set of variables is shown to correspondents. The combination keeps changing, and consumer preferences are recorded. Once the optimum combination of variables is determined, the right offering can be made. Such an offering would contribute towards a higher market share, better revenue inflow and higher margins. Also, the business can focus on only those factors which are considered most important by consumers.
Based on recurring discussions with various student fraternities residing in the Business School campus and also studying the operations of the existing restaurant and food joints in the campus, a set of attributes and corresponding levels were designed for the analysis. Informal discussions were also done regarding the types of food outlets and practices across other management and engineering colleges and universities in the country.
The relevant attributes and levels as designed are as below:
| S.No | Attribute | Levels | Dummy variable Assigned |
Numbers for each level attribute |
| 1 | Food Price | High | x11 | 1 |
| Medium | x12 | 2 | ||
| Low | x13 | 3 | ||
| 2 | Restaurant Concept | Fast Food | x21 | 1 |
| Fast Casual | x22 | 2 | ||
| Café or Bistro | x23 | 3 | ||
| Food Truck | x24 | 4 | ||
| 3 | Restaurant Décor | Sporty | x31 | 1 |
| Convenience | x32 | 2 | ||
| Comfort | x33 | 3 | ||
| 4 | Food Type | Indian | x41 | 1 |
| Continental | x42 | 2 | ||
| Chinese | x43 | 3 | ||
| 5 | Diet Type | Veg | x51 | 1 |
| Non Veg | x52 | 2 | ||
Fig 2: Attributes, levels and numerics
There are (3 * 4 * 3 * 3 * 2) 216 possible restaurant profiles based on the attributes and the levels. Each of the profile can become a unique type of restaurant. Given the large number of profiles it was immensely difficult to allow consumers to determine their preference ranking from all these profiles. To fine tune this process, orthogonal arrays were generated to create a smaller set of restaurant profiles also known as design cards or plan cards. Few hold out cards to be used for validation of the output results as obtained
1.1 Execution and Results
The conjoint analysis was run using the files as mentioned in the syntax file and the results are listed in the following section.
Based on the results of the utilities section of the analysis, the Regression equation can be stated as below:
U(x) = 8.106 + (-0.0909)x11 + (0.909)x12 + (-0.818)x13 + (0.8636)x21 + (-0.931)x22 + (1.3636)x23 + (-1.295)x24 + (1.409)x31 + (0.488)x32 + (-1.897)x33 + (0.257)x41 + (-3.094)x42 + (2.837)x43 + (-1.670)x51 + (1.670)*x52
The indicators of the model fit as obtained are:
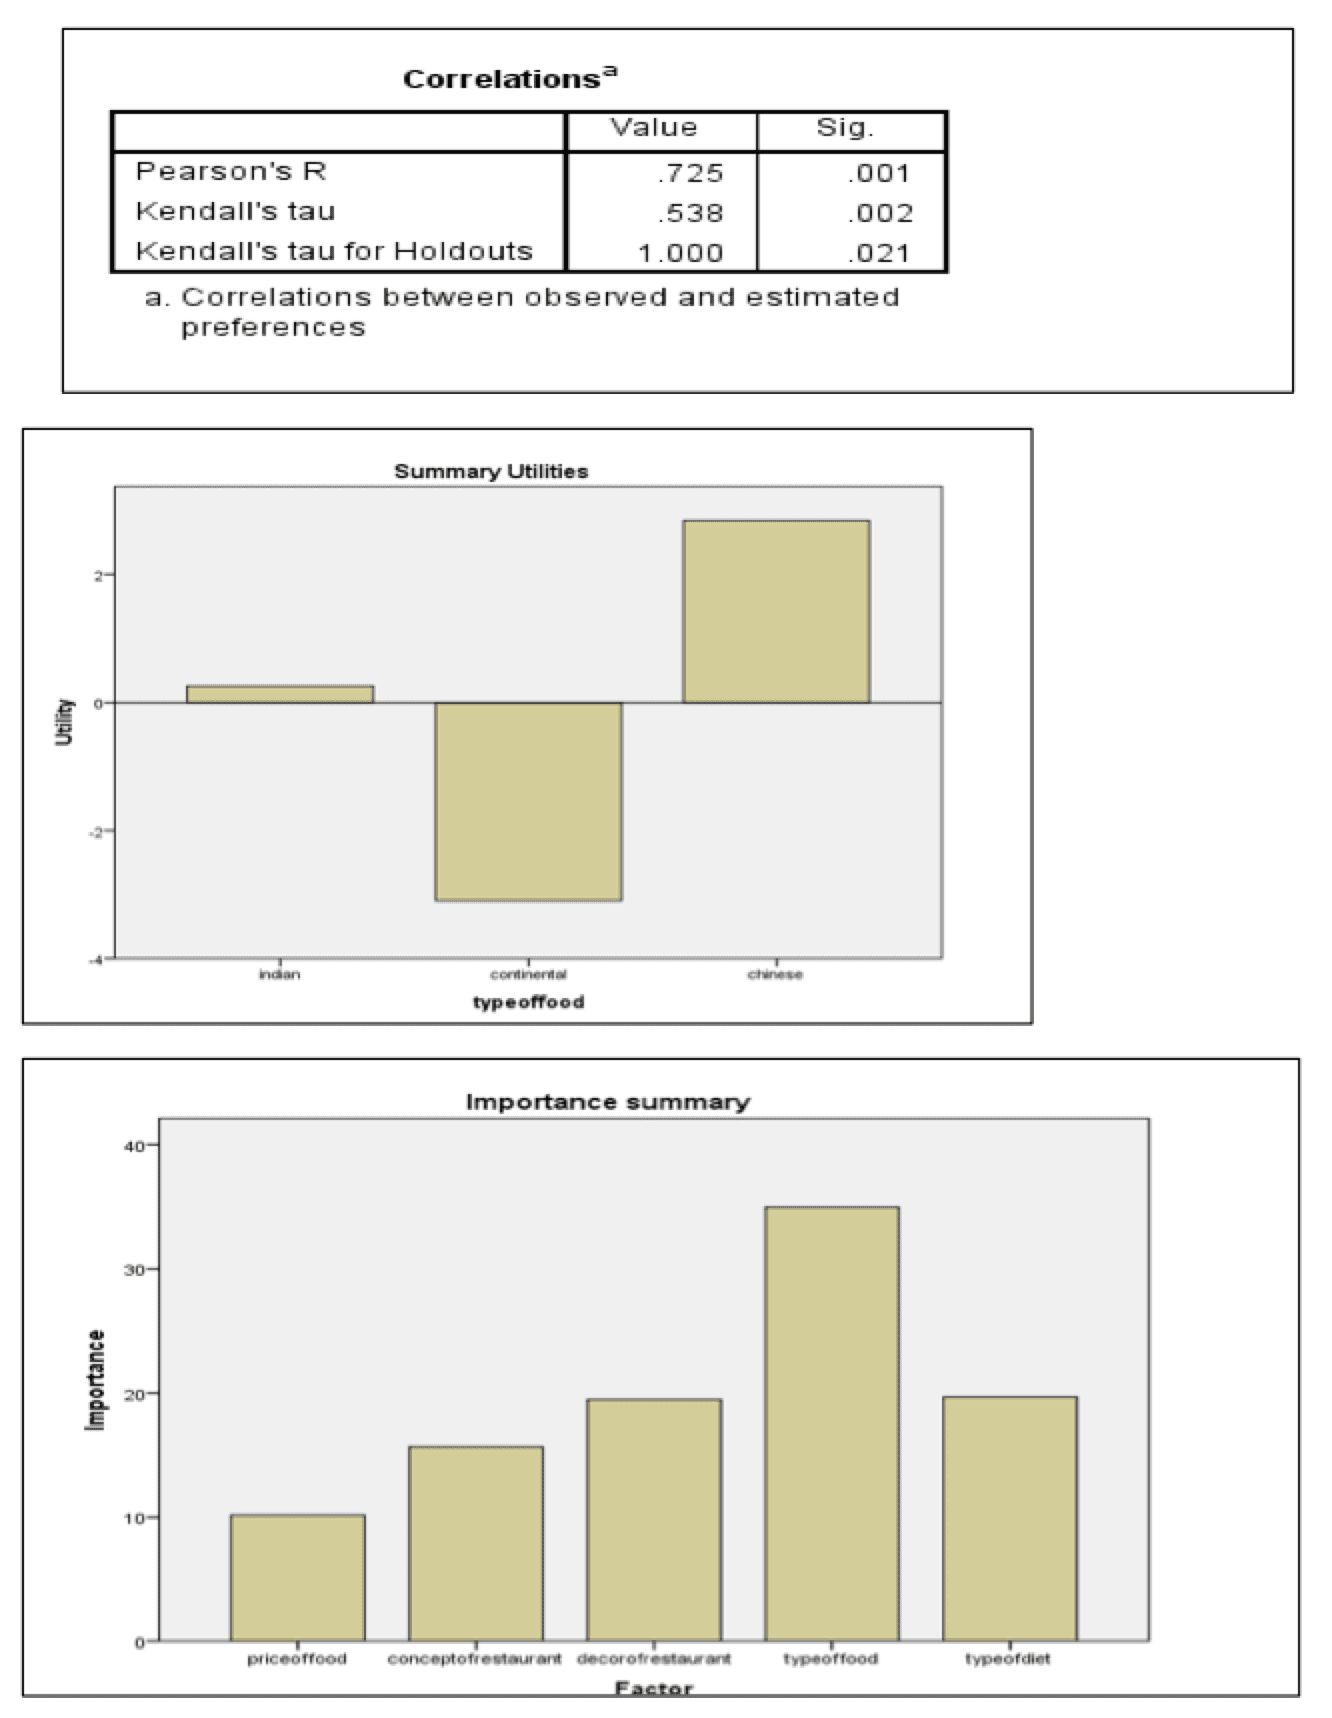
2. Conclusion
The following conclusions can be made:
- The most important factor (out of the chosen ones) for people while choosing a restaurant is the type of food served. This is quite logical as one would go to a restaurant only if it serves the food he/she wants. Also, the preference for Chinese food is greatest among the student community, followed by Indian food. Continental food is least preferred.
- The restaurant décor and diet type are almost equally important for the community. More people prefer non-veg food, suggesting that there are already plenty of options for vegetarian food on campus. Also, the atmosphere of the restaurant should be sporty, which is in line with the young average age of the student community members (given that most people visiting restaurants on the campus are students). These young people prefer sporty and fun atmosphere, where they can hang out with their friends.
Authors:
Aditya Nawani
Arnab Maity
Peeyush Pachauri
Rohit Sharma
Supratim Choudhury,
Indian Institute of Management Ahmedabad.


