


 When a vehicle manufacturer launches a new model then it has to dole out generous warranty to the buyers. Since the model is new hence excellent warranty boosts the confidence of the buyers and encourages them to buy. But this is only one aspect of the sale and on the other hand, the manufacturer has to ensure that vehicle should not consume more than anticipated budget towards warranty. Higher warranty cost reduces the profit margin of the vehicles sold. But unfortunately, it is easier said than done. Since the vehicle is undergoing the production first time so there is always a manufacturing risk for various parts which are difficult to catch even after rigorous testing and field trials.
This article focuses on the use of analytics to determine which component of the vehicle is subjected to maximum wear and tear in initial few months after the launch. Such statistical analysis provides useful information to the manufacturer to relook into product design and manufacturing for the part where maximum problems are encountered. A proactive detection and technical fix reduces the possibility of the further failure and in turn warranty cost.
Today’s modern vehicles have multiple inbuilt computing machines [ECU – Electronic Control Unit] inside the vehicles. The purpose of these ECUs is to control the operation of various features of the car like ABS [Antilock Braking System], Fuel/Ignition control aka MPFI, AC Control, Car window and seating control and so on. Embedded software inside the ECUs not only controls the operation but also provides the faults detection feature of the controlling module.
Today’s modern vehicles are fitted with a dedicated OBD [Onboard Diagnostics] connector. Service technician connects the handheld device or laptop where software application communicates with the Vehicle’s ECUs via OBD connector to retrieve the fault codes. These fault codes are known as DTC or Diagnostics Trouble Codes. DTCs help the technician to figure out nature of fault as well as the location or affected module which requires servicing/replacement etc. OBD-II fault codes are standardized for across the globe including India.
This article explains the use of the Cloud-based system to capture the DTCs data from various service stations spread across a specific geo or even entire world. Now assume that each service station is provided with a mechanism to push the identified DTC to the remote server via Cloud ecosystem. So in this way, a huge database builds up on the remote cloud-based server for various fault records. A thorough statistical analysis of the fault code helps to develop a pragmatic insight to zero-in on the problem areas of the vehicle. In the server clustering of the DTCs are required for different geographies because the environment changes a lot from place to place so does the nature of faults. Faults found in Arizona would be far different than Alaska.
Vehicle manufacturer can gather the faults records or DTCs from various service centers after the vehicle launch and analysis it periodically [weekly, bi-weekly, monthly, quarterly] to identify a logical pattern for the fault records. In order to understand how analytics help here we need to first understand the interpretation of DTC below:
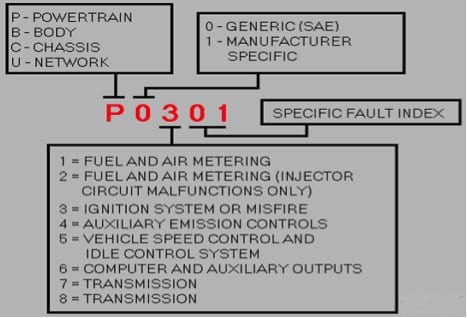
As shown in above figure, each DTC or fault code is a 5 digit number. Each digit has its own interpretation. For example, DTC C1412 means it’s for chassis system and the fault is manufacture specific, related to auxiliary emission control and it’s the 12th fault of this category. A simple analytics technique known as decision tree will give a very useful information to identify the concentration of the fault to the vehicle manufacturer. Let’s look at the table below where a hypothetical set of DTCs are recorded. A visual inspection might not provide any meaningful insight but when we will apply a decision tree technique on this data set then an interesting pattern emerges.
|
Month |
DTC |
|
1…. |
P0301,P0211,P1100,P0212,P0302,P0303,P0701,P0304,P0803,C0111,C0310 |
|
2…. |
P0212,P0301,P1103,P0302,P0302,P0303,P0802,P0304,P0201,C0811 |
Above table shows the list of DTC recorded with monthly frequency. Decision tree, when applied on this table, will look like as shown below:
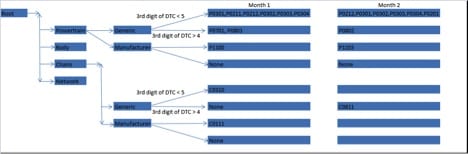
So now let’s try to analyze what the decision tree says:
1) Majority of the faults are associated with power-train [when 1st digit of DTC Code is P]
2) Majority of the faults are associated with DTC when 3rd digit is 3. It means faults are coming from ignition system.
3) OBD-II specification says that P03XX occurs when engine misfires i.e. engine is hard to start. Analysis of last two digits clearly says that fault is coming due to cylinder misfiring.
4) So there could be various reasons for engine misfiring [refer to http://www.obd-codes.com/ for more details]:
- Faulty spark plug or wire
- Faulty coil (pack)
- Faulty oxygen sensor(s)
- Faulty fuel injector
- Burned exhaust valve
- Faulty catalytic converter(s)
- Running out of fuel
- Poor compression
- Defective ECU/PCM Module
Above historical analysis of the DTCs allow the vehicle manufacturer to take a close look at the power-train assembly of engine firing system. Manufacture now can correct the technical issue and reduce the warranty cost in subsequent batches. Moreover 2nd digit of the DTC code provides the flexibility to the manufacturer to design its own fault codes. Manufactures can add them to monitor the behavior of the new parts introduced in the vehicle production first time.
Of course above analysis is performed over a very small dataset so it is not reliable. But vehicle manufacturer can store huge amount of datasets or samples to run such analysis. Typically every vehicle generates 100-150KB of useful data from field every year. Since data is collected from across the geo or even world hence volume would be very big. This huge volume will generate a reliable insight about frequently occurring faults by simple use of decision tree method. Generated data can be benchmarked against another successful model from competitor for comparison.
Needless to say when dataset is huge then manual decision tree analysis is impossible to perform. Though there are many analytics tool are available in the market which directly operates over database and generates the reports. These tools even allow a lot of flexibility to the users to tune the rules of decision tree. So summery is that now a day’s no vehicle manufacturer can deny the power of analytics and can use it to its own benefits.


