Analytics India Magazine completed 1 year in existence. It’s time to look back at this 1 year and analyze how we performed in terms of visitors on the site.
Per our rough estimate, we touched almost half of all analytics professionals in India. This misses a majority of analytics professionals and we have a huge audience base still to capture.

On an average, our monthly traffic increased 28% month on month. The traffic has increased by almost 10 times since we started a year back.
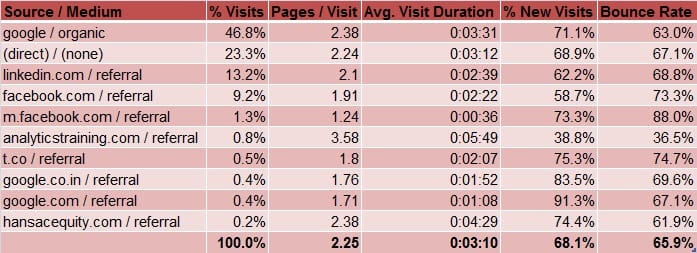
The Avg. Visit Duration on the site has been 3 mins 10 secs. Our visitors browsed on an average 2.2 pages on each visit. % New Visits appears very high; implying just 32% of visitors came back to site. Yet, for our returning visitors the matrices appear much better than overall. Almost 7% of returning visitors visit the site after 1 month of their previous visit.

The weakest metric is that of visit duration on the site. 68% of visitors closed the page within 10 sec of their landing. 20% visitors browsed the site for more than 2 mins, just 2% for more than half hour. 66% of visitors just visited 1 page on the site. The graph below gives % visits for page depths more than 1.

47% of traffic to the site is through search, top 5 search keywords being – “analytics india magazine”, “analytics companies in india”, “business analytics course”, “data analytics courses”, “analytics magazine india”. 45% of referral traffic is from Linkedin, while 36% is from Facebook.