After the success of the “other” club from the Spanish Capital, the La liga has now become a three horse race. Spanish football, always regarded as beautiful and technical, has now a new style – the physical and brash kind of football. The competitiveness drilled into the team by their coach Diego Simeone helped Atletico Madrid overcome their financial deficiencies compared to the “Big Two” of La Liga and claimed the title in 2014.
We will try to play with data using a Tableau dashboard to understand few aspects of the top three teams of La Liga.
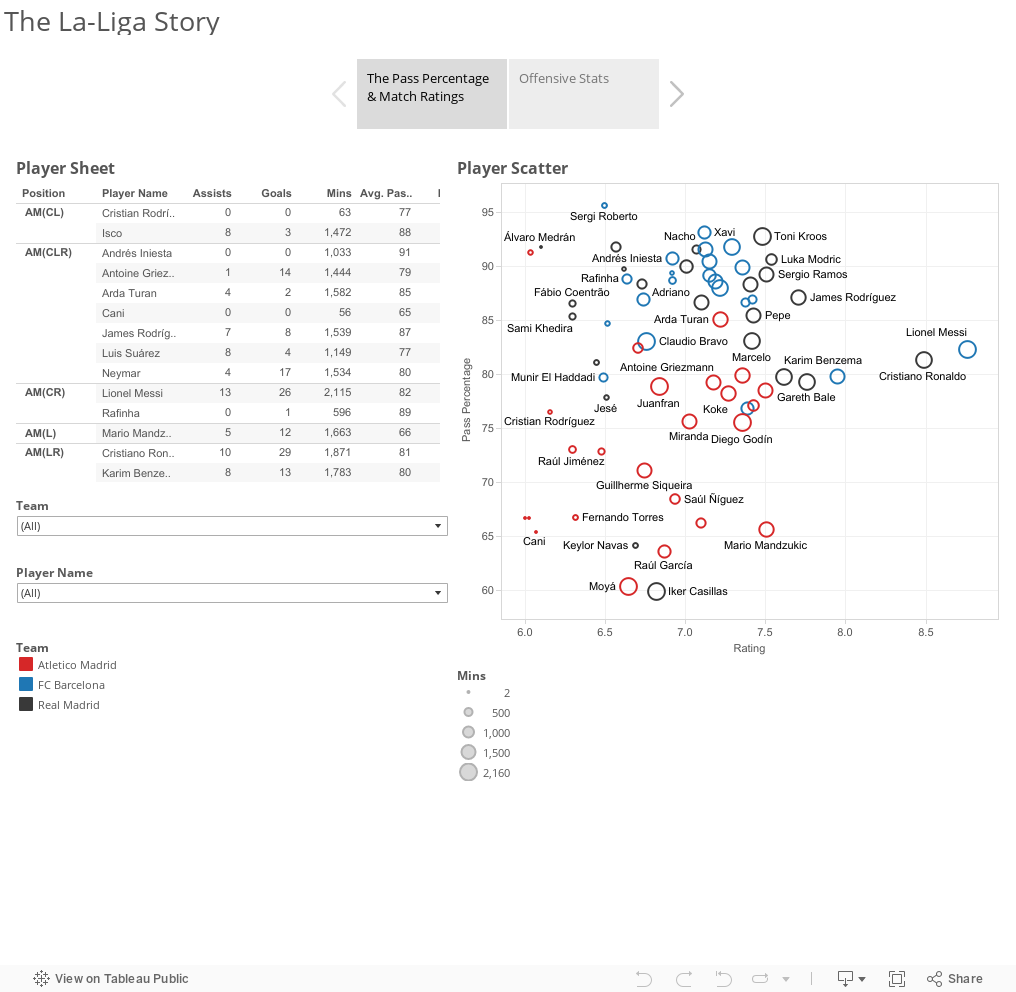
1. Why Ronaldo and Messi are the Best Players in the World : Not only according to public opinions, even data tells us that CR7 and Messi stand heads and shoulders apart from the rest. Be it in the overall match ratings or racking up goals and assists, the duo is far ahead from the pack. To check their stats so far in the season we just need to hover our mouse over the two outlying data points!
Atletico Madrid dont have such individual talent. They make it up by playing as a team with their top performer Mario Mandzukic lying far behind from Ronaldo and Messi.
2. The Supporting Cast : Cristiano Ronaldo is ably supported by the other two members of the BBC alongwith the new signed World Cup sensation James Rodriguez. The German Machine Toni Kroos may not be up there with the goals but he provides assists regularly. James’s impressive season can be seen as he lies up there with the BBC. Kroos and Modric provides efficiency in the midfield with over 90% pass completion rate. The spanish sensation Isco has also provided his services to the forward line of Real Madrid.
Neymar, the Brazilian trickster and speedster, is just behind Ronaldo and Messi in racking up goals and assists ready to carry the Brazilian mantle forward. The Barcelona midfield as always shows efficiency in retaining the ball with high pass completion though the aging midfield’s assists and match ratings show dip and falling behind their Madrid counterparts.
The scattered Atletico Madrid players in the pass percentage page shows they are not exactly ball players. May be thats why they are more reliant on the set pieces.
3. The Wall of Defence : The Atletico Madrid defenders have provided important goals from set pieces with Diego Godin lying up there with the attackers and midfielders. The big CDMs Tiago and Gabi’s goals speak up their set piece strengths.
Real Madrid like like their mercurial Marcelo bomb forward and providing crosses shown by the number of assists he bags. Sergio Ramos and Pepe not only provide some help with their set piece ability, they also maintain a high pass percentage and like to carry the ball forward.
The Barca’s defence seems to lie together in our dashboard failing to provide interesting insights though the high pass completion of Claudio Bravo shows Barcelona like to play the ball from the box rather than clearing it.
4. The Subs: Carlo Ancelotti is not a big fan of rotation policy. The dashboard confirms the fact by showing the higher minutes to only 12 players proving a consistent starting 11. The subs have proved to be benchwarmers and have struggled for minutes.
Luis Enrique was criticized for not having a stable playing 11 and the circles show distributed minutes among the players.
Diego Simeone have rotated around 16 players with the “returning home” Fernando Torres still to play some important minutes.
I hope you all have enjoyed my post. Why not play around with the dashboard, bring up some more insightful facts and post in the comments section for others.
(Data Source : whoscored.com till mid Feb 2015)