An analytical model is a statistical model that is designed to perform a specific task or to predict the probability of a specific event.
In layman terms, a model is simply a mathematical representation of a business problem. A simple equation y=a+bx can be termed as a model with a set of predefined data input and desired output. Yet, as the business problems evolve, the models grow in complexity as well. Modeling is the most complex part in the lifecycle of successful analytics implementation.
Scalable and efficient modeling is critically consequential to enable organizations to apply these techniques to ever-more sizably voluminous data sets for reducing the time taken to perform these analyses. Thus models are engendered that implement key algorithms to determine the solution to our business quandary.
Supervised vs Unsupervised learning models
Supervised Learning models are the models where there is a clear distinction between explanatory and dependent variables. The models are trained to explain dependent variables using explanatory variables. In other words, the model output attributes are known beforehand. Eg:
- Prediction (e.g., linear regression)
- Classification (e.g., decision trees, k‐nearest neighbors)
- Time‐series forecasting (e.g., regression‐based)
In unsupervised learning, the model outputs are unknown or there are no target attributes: there is no distinction between explanatory and dependent variables. The models are created to find out the intrinsic structure of data. Eg:
- Association rules
- Cluster analysis
Here we plan to briefly discuss the following 10 basic machine learning algorithms/ techniques that any data scientist should have in his/her arsenal. There are many more techniques that are powerful, like Discriminant analysis, Factor analysis etc but we wanted to focus on these 10 most basic and important techniques.
Machine Learning Algorithms
1. Hypothesis Testing
2. Linear Regression
3. Logistic Regression
4. Clustering
5. ANOVA
6. Principal Component Analysis
7. Conjoint Analysis
8. Neural Networks
9. Decision Trees
10. Ensemble Methods
1. Hypothesis Testing
Hypothesis testing is not exactly an algorithm, but it’s a must know for any data scientist. Do not move ahead before you completely master this technique.
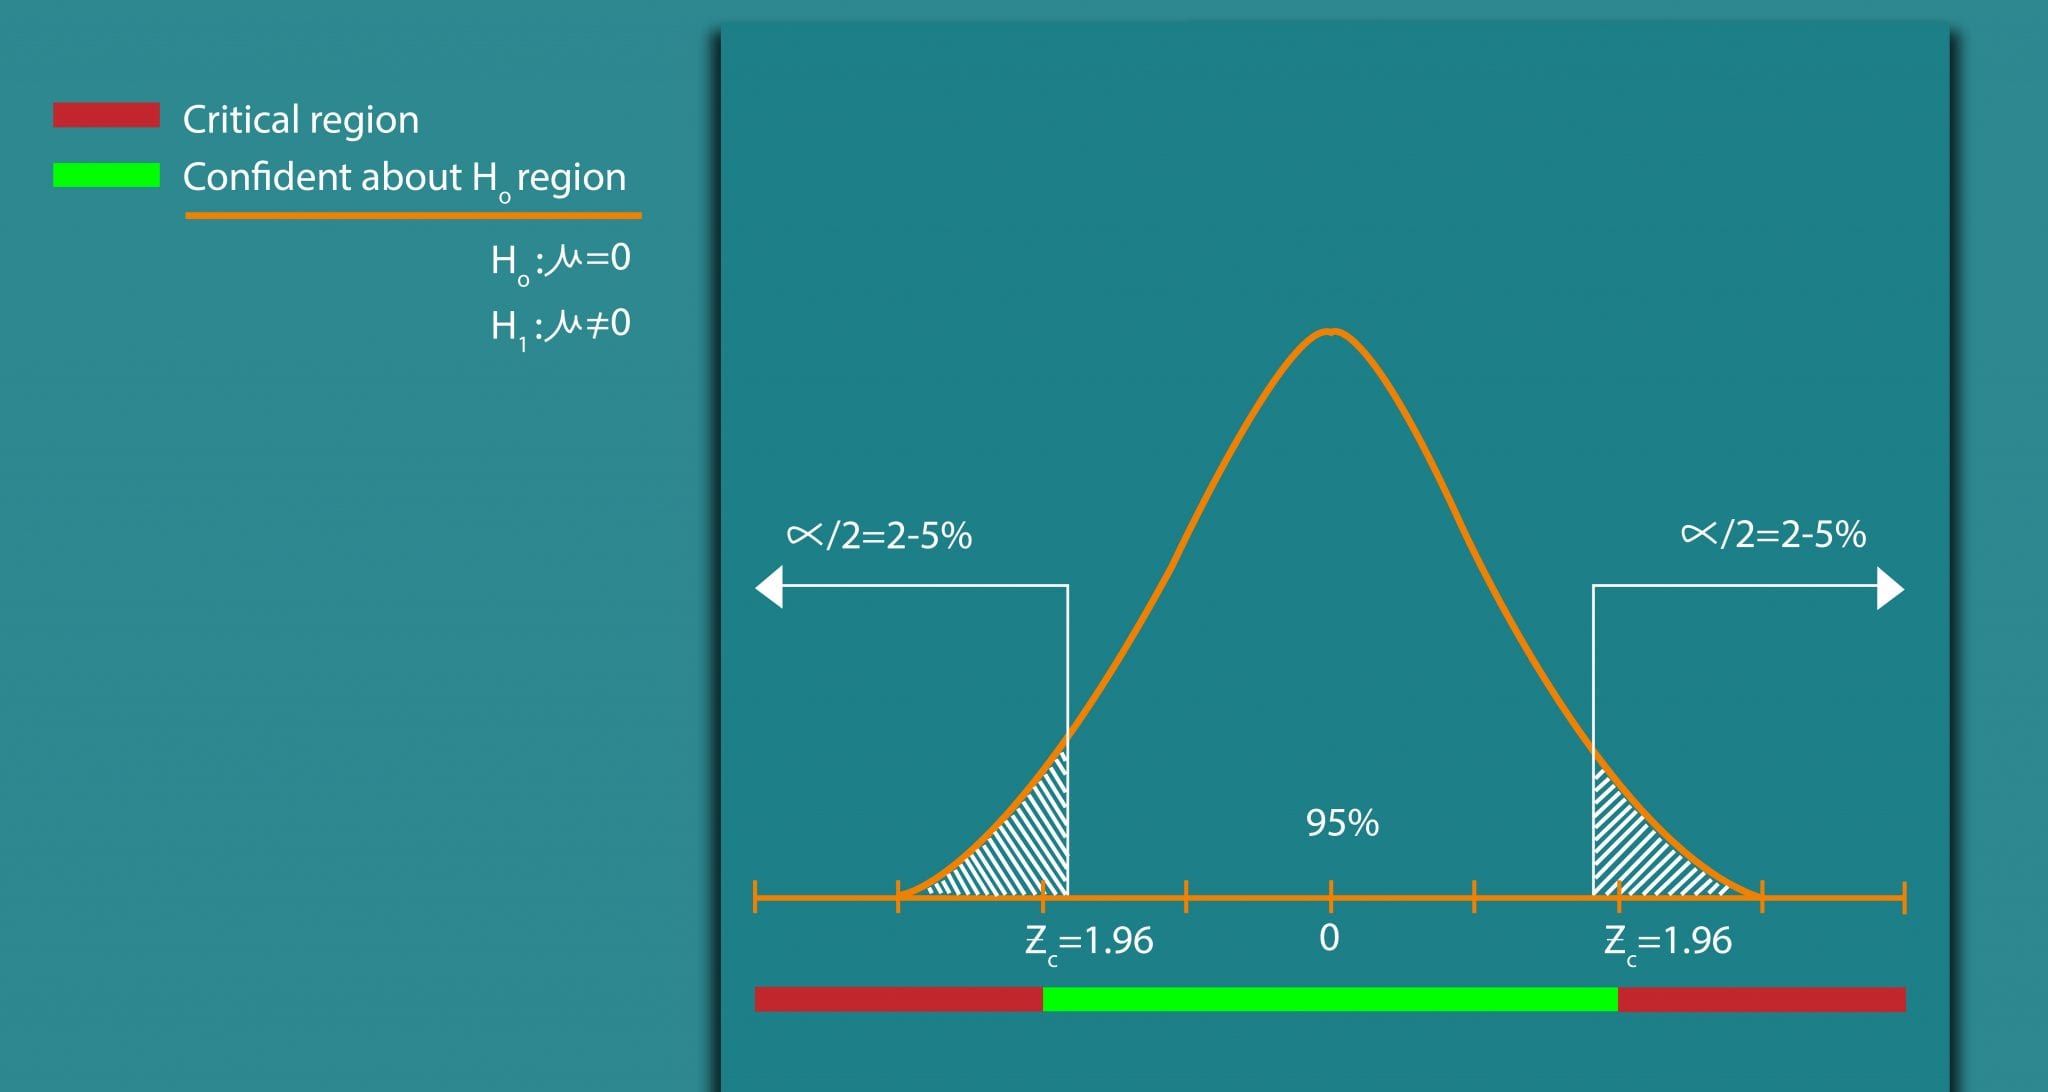
Hypothesis testing is the process in which statistical tests are used to check if a hypothesis is true or not using the data. Based on hypothetical testing, we choose to accept or reject the hypothesis. When an event occurs, it can be a trend or happens by chance. To check whether the event is an important occurrence or just by chance, hypothesis testing is necessary.
There are many tests for hypothesis testing, but the following 2 are most popular:
- t-test: t-test is a popular statistical test to make inferences about single means or inferences about two means or variances to check if the two groups’ means are statistically different from each other where n<30 and standard deviation is unknown.
- Chi-square test: A chi square (χ2) test is used to examine if 2 distributions of categorical variables are significantly different from other.
2. Linear Regression
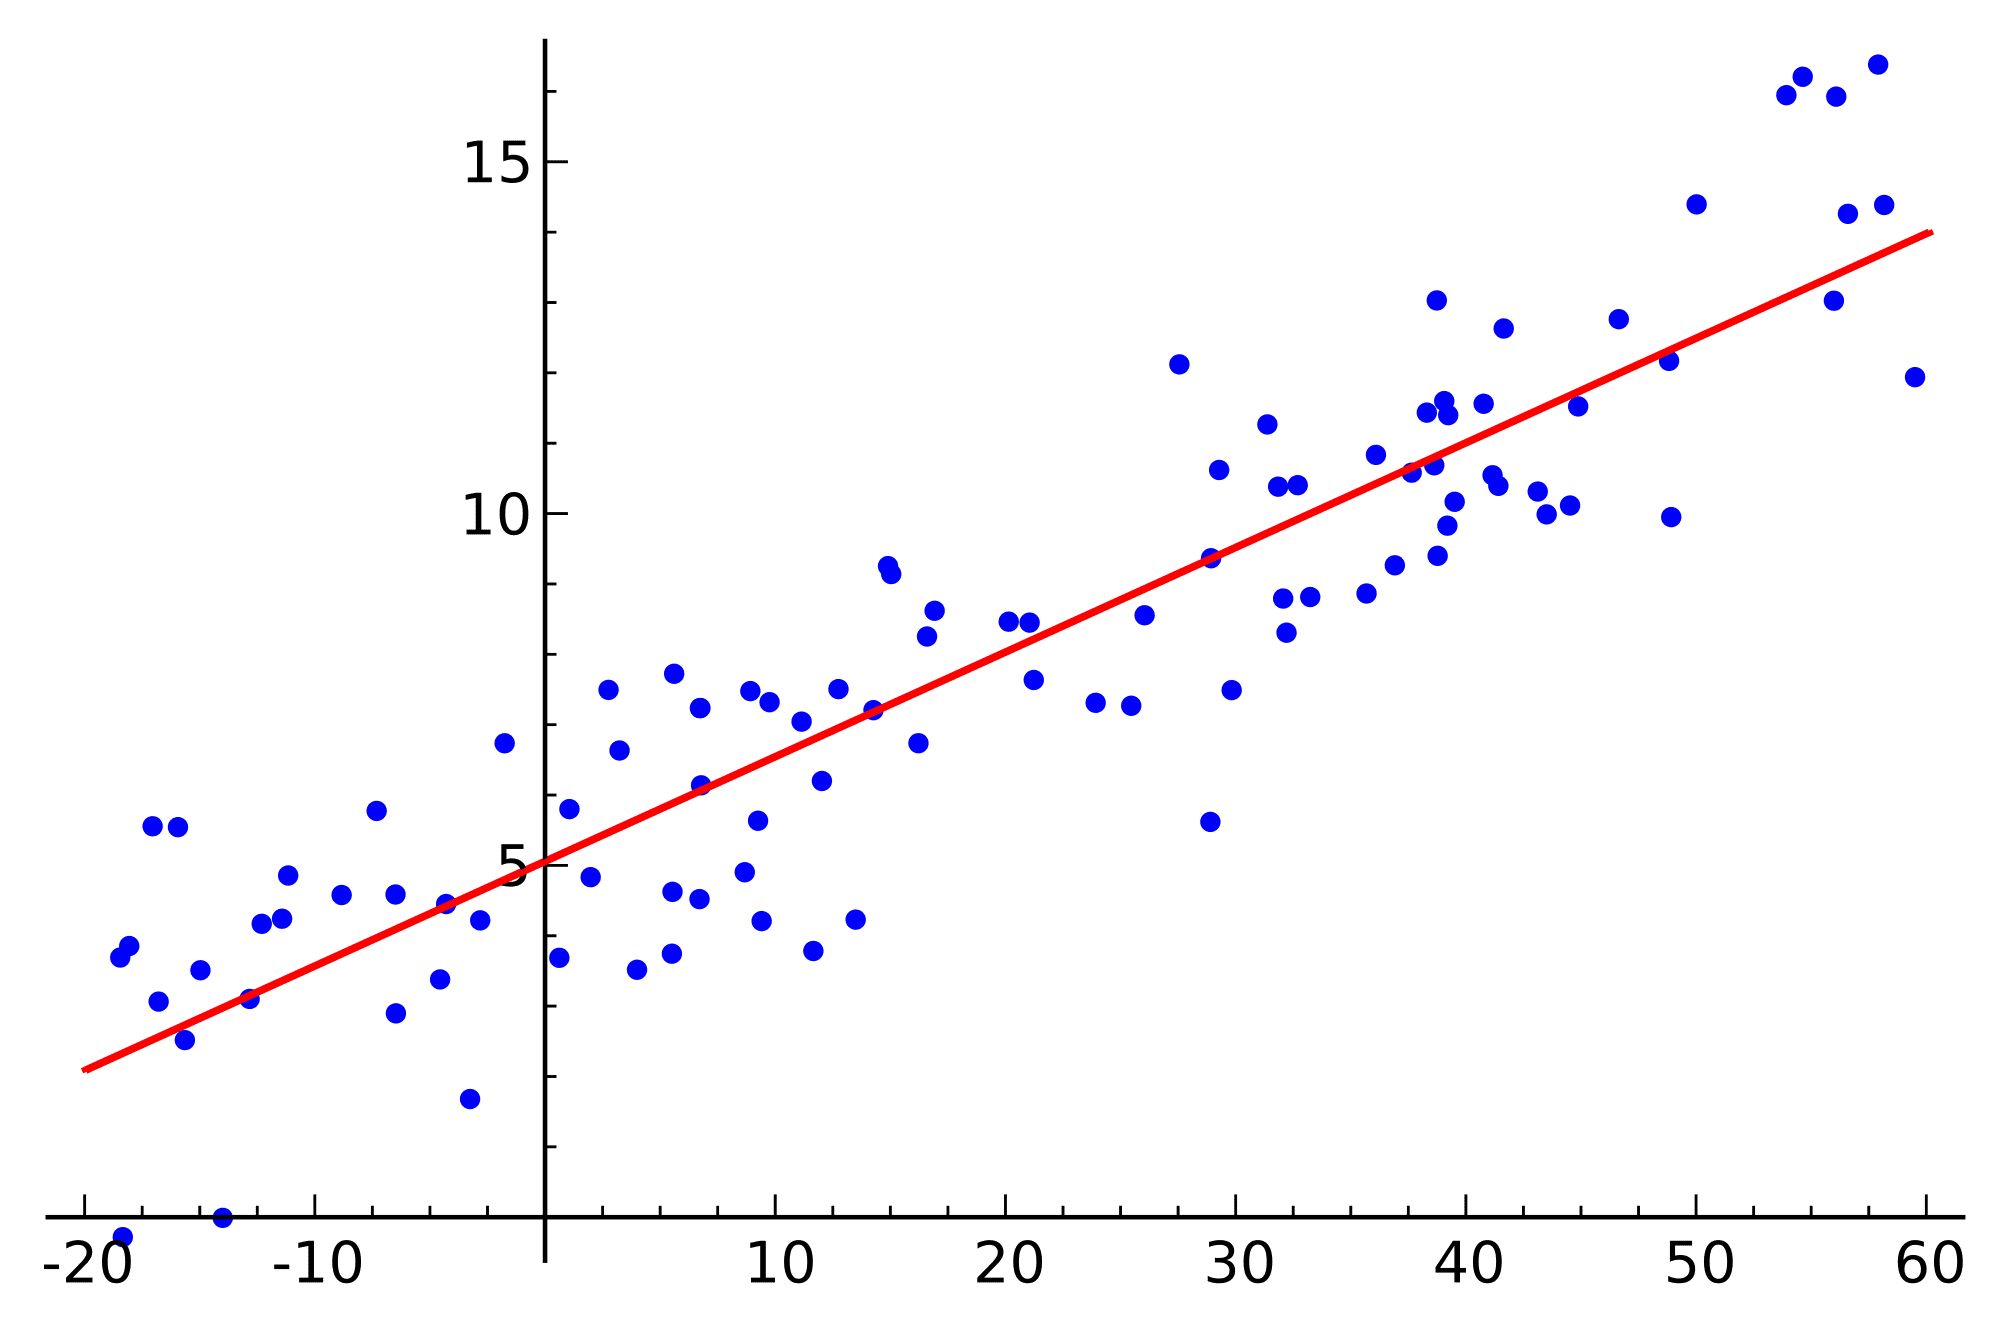
Linear regression is a statistical modelling technique, which attempts to model the relationship between an explanatory variable and a dependent variable by fitting the observed data points on a linear equation. For eg: Modelling the BMI of individuals using weight.
A linear regression is used if there is relationship or significant association between the variables. This can be checked by scatterplots. If no association appears between the variables, fitting a linear regression model to the data will not provide useful model.
A linear regression line has equation in the following form:
Y = a + bX,
Where, X = explanatory variable and
Y = dependent variable.
b = slope of the line
a = intercept (the value of y when x = 0).
3. Logistic Regression
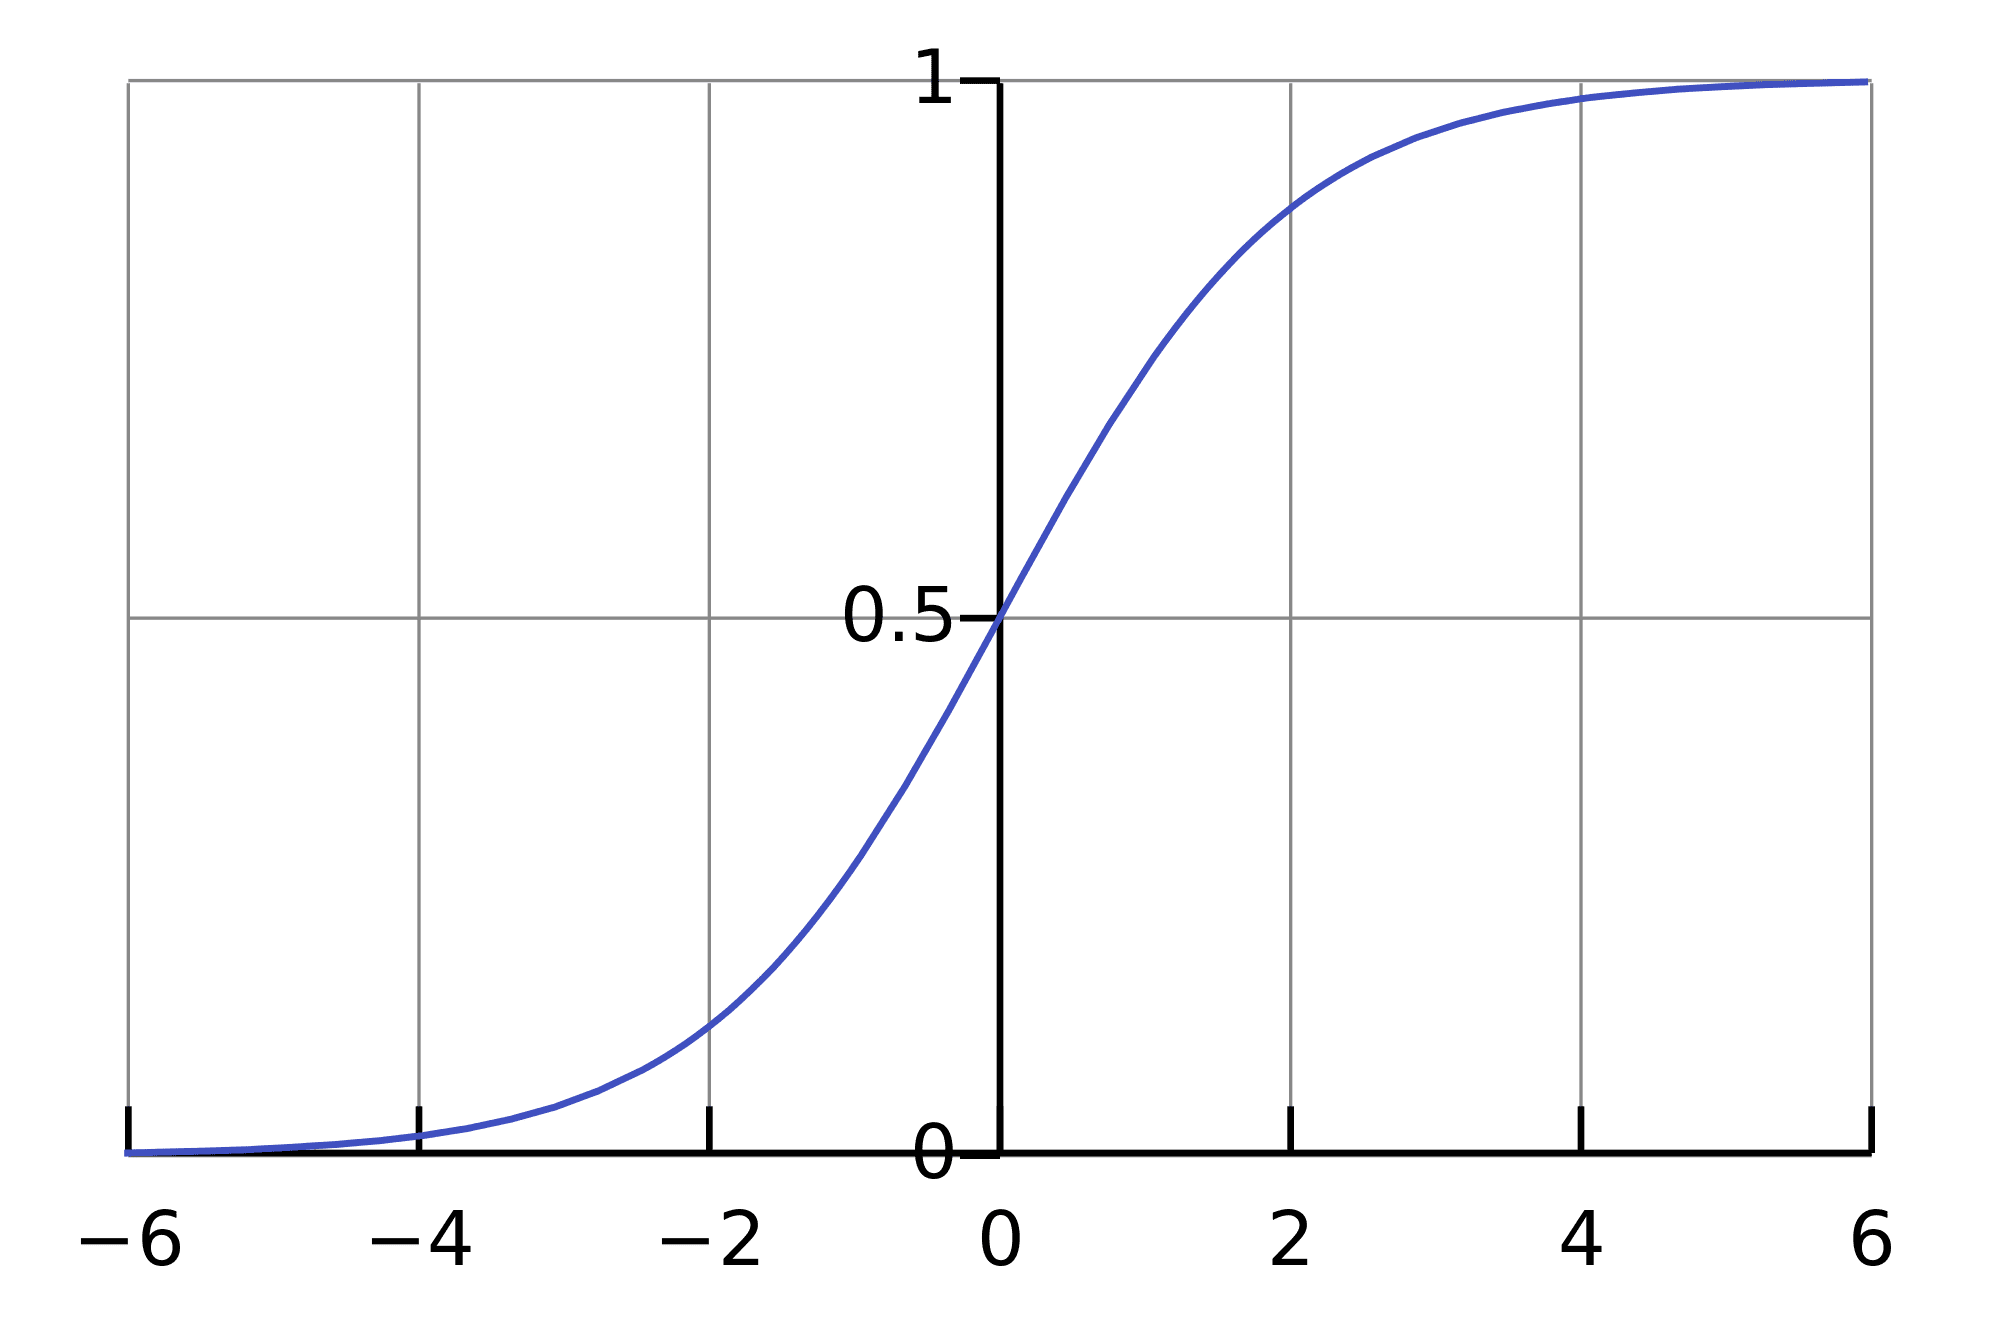
Logistic regression is the technique to find relationship between a set of input variables and a output variable (just like any regression) but the output variable in this case would be a binary outcome (think of 0/1 or yes/no).
For eg: Will there be traffic jam in a certain location in Bangalore is a binary variable. The output is a categorical Yes or no.
The probability of occurrence of traffic jam can be dependent on attributes like weather condition, day of week and month, time of day, number of vehicles etc. Using logistic regression, we can find the best fitting model that explains the relationship between independent attributes and traffic jam occurrence rates and predicts probability of jam occurrence.
4. Clustering Techniques
Clustering (or segmentation) is a kind of unsupervised learning algorithm where a dataset is grouped into unique, differentiated clusters.
Lets say, we have customer data spanning 1000 rows. Using clustering we can group the customers into differentiated clusters or segments, based on the variables. In case of customers’ data, the variables can be demographic information or purchasing behavior.
Clustering is an unsupervised learning algorithm because the output is unknown to the analyst. We do not train the algorithm on any past input – output information, but let the algorithm define the output for us. Therefore (just like any other modeling exercise), there is no right solution to clustering algorithm; rather the best solution is based on business usability. Some people also call Clustering as unsupervised classification.
There are 2 basic types of clustering techniques:
- Hierarchical clustering
- Partitional clustering
5. ANOVA
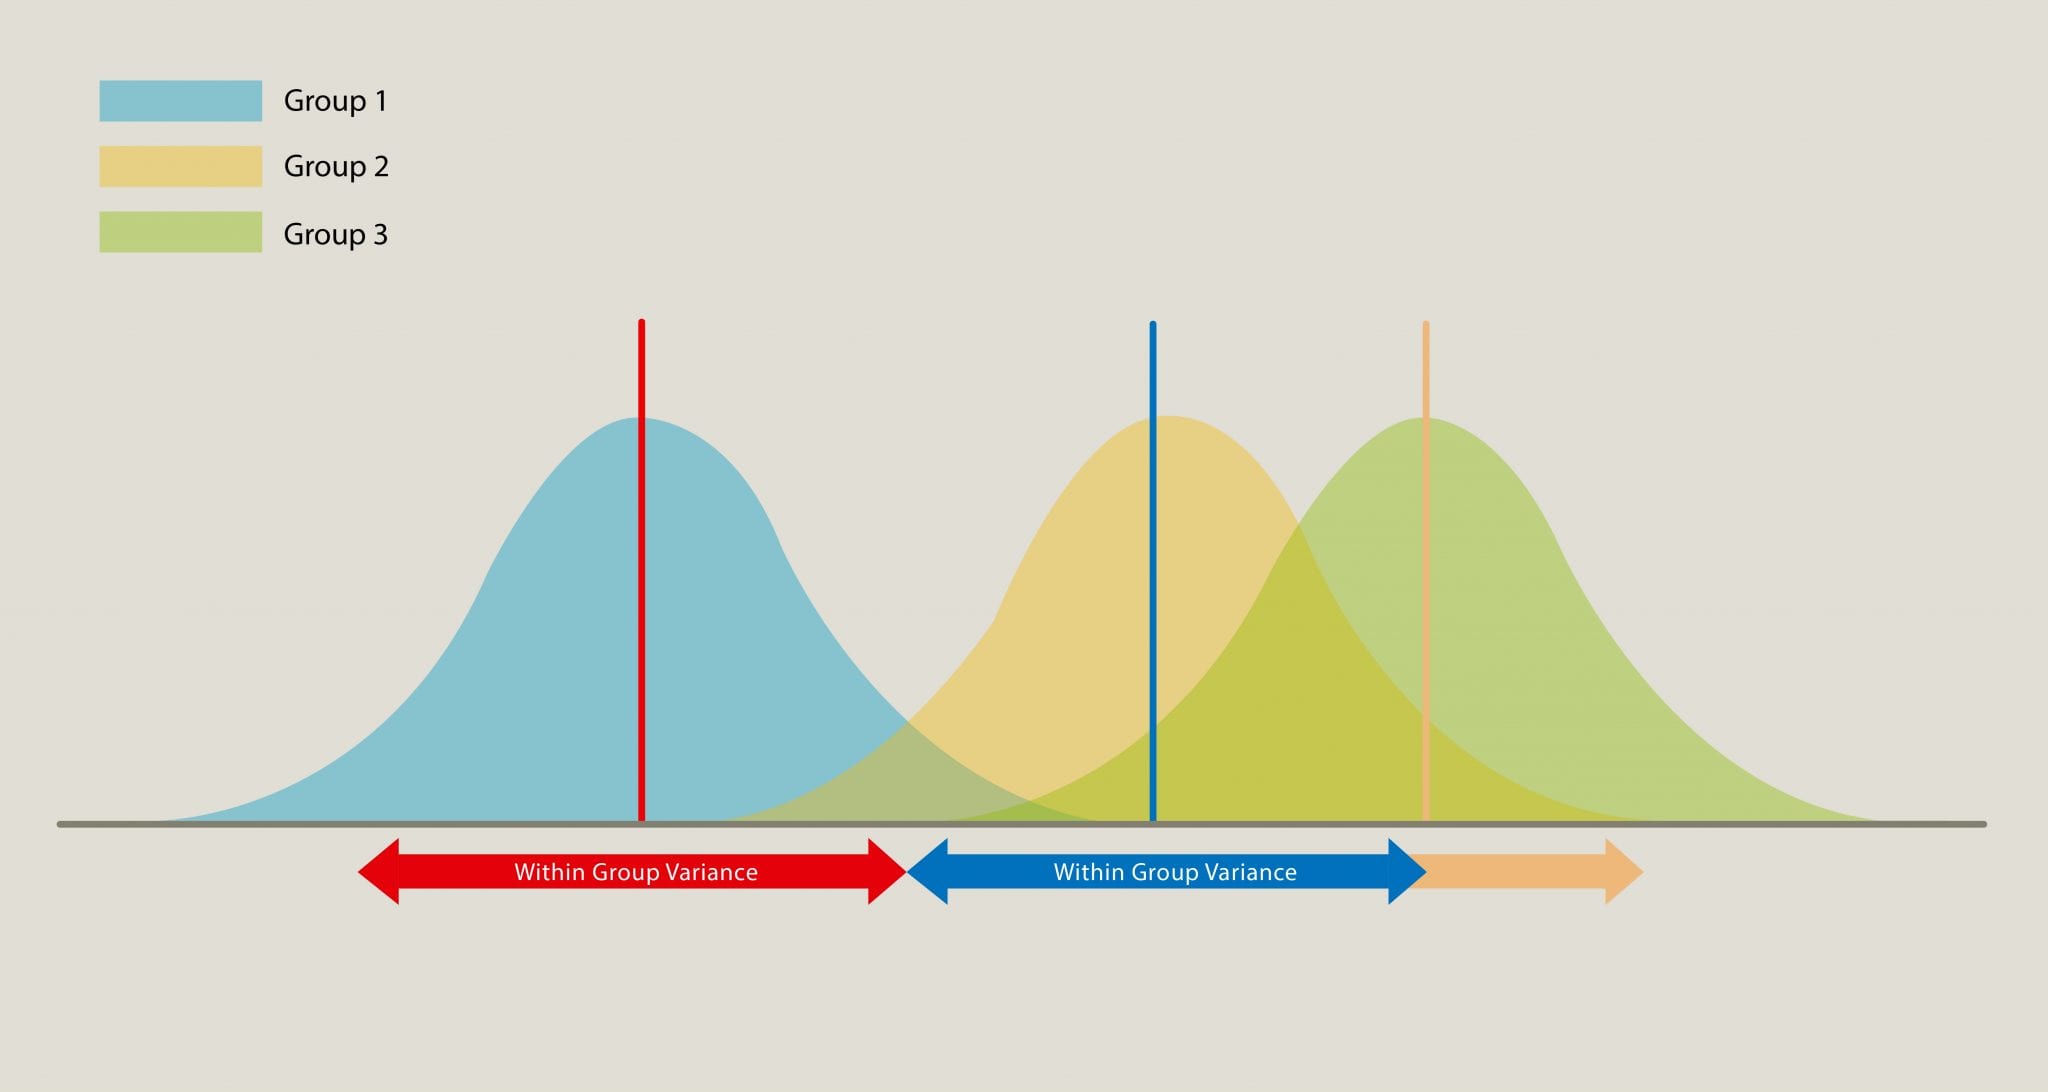
The one-way analysis of variance (ANOVA) test is used to determine whether the mean of more than 2 groups of dataset are significantly different from each other.
For eg. A campaign of BOGO (Buy one get one) is executed on 5 groups of 100 customers each. Each group is different in terms of their demographic attributes. We would like to determine whether these 5 respond differently for the campaign. This would help us optimize the right campaign for the right demographic group, increase the response rate and reduce cost of campaign.
The “analysis of variance” works by comparing the variance between the groups to that of within group variance. The core of this technique lies in the assessing whether all the groups are infact part of one larger population or completely different population with different characteristics.
6. Principal Component Analysis
Dimension (variable) reduction techniques aim to reduce the data set with higher dimension to that of lower dimension without the loss of feature of information that is conveyed by the dataset. The dimension here can be conceived as the number of variables that a data set contain.
Two commonly used variable reduction techniques are:
- Principal Component Analysis (PCA)
- Factor Analysis
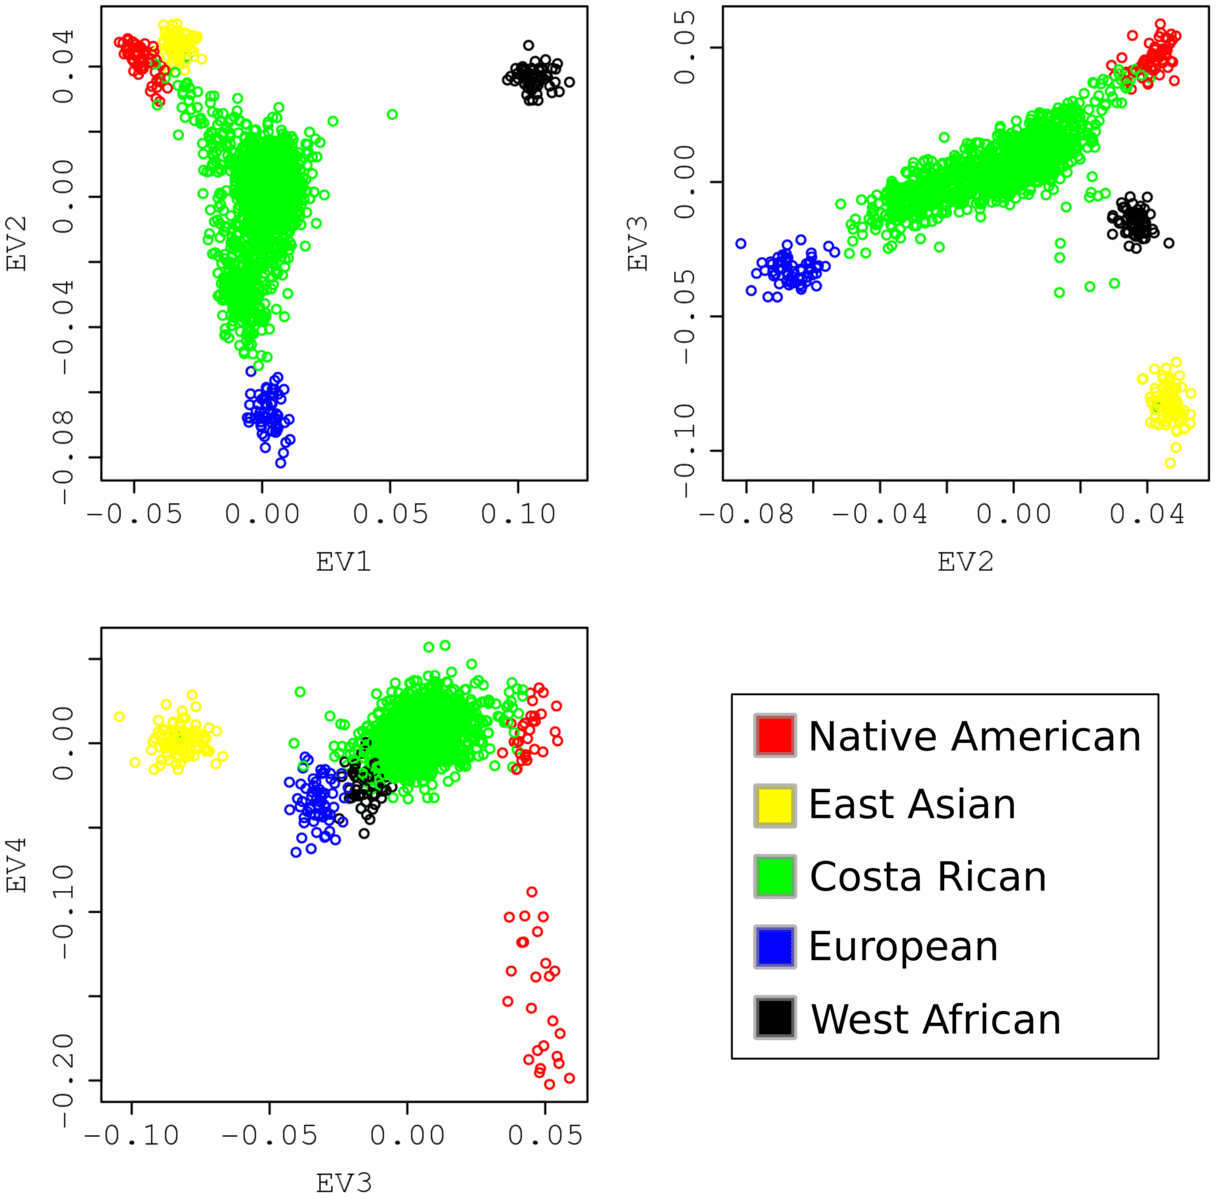
The crux of PCA lies in measuring the data from perspective of a principal component. A principal component of a data set is the direction with largest variance. A PCA analysis involves rotating the axis of each variable to highest Eigen vector/ Eigen value pair and defining the principal components i.e. the highest variance axis or in other words the direction that most defines the data. Principal components are uncorrelated and orthogonal.
7. Conjoint Analysis
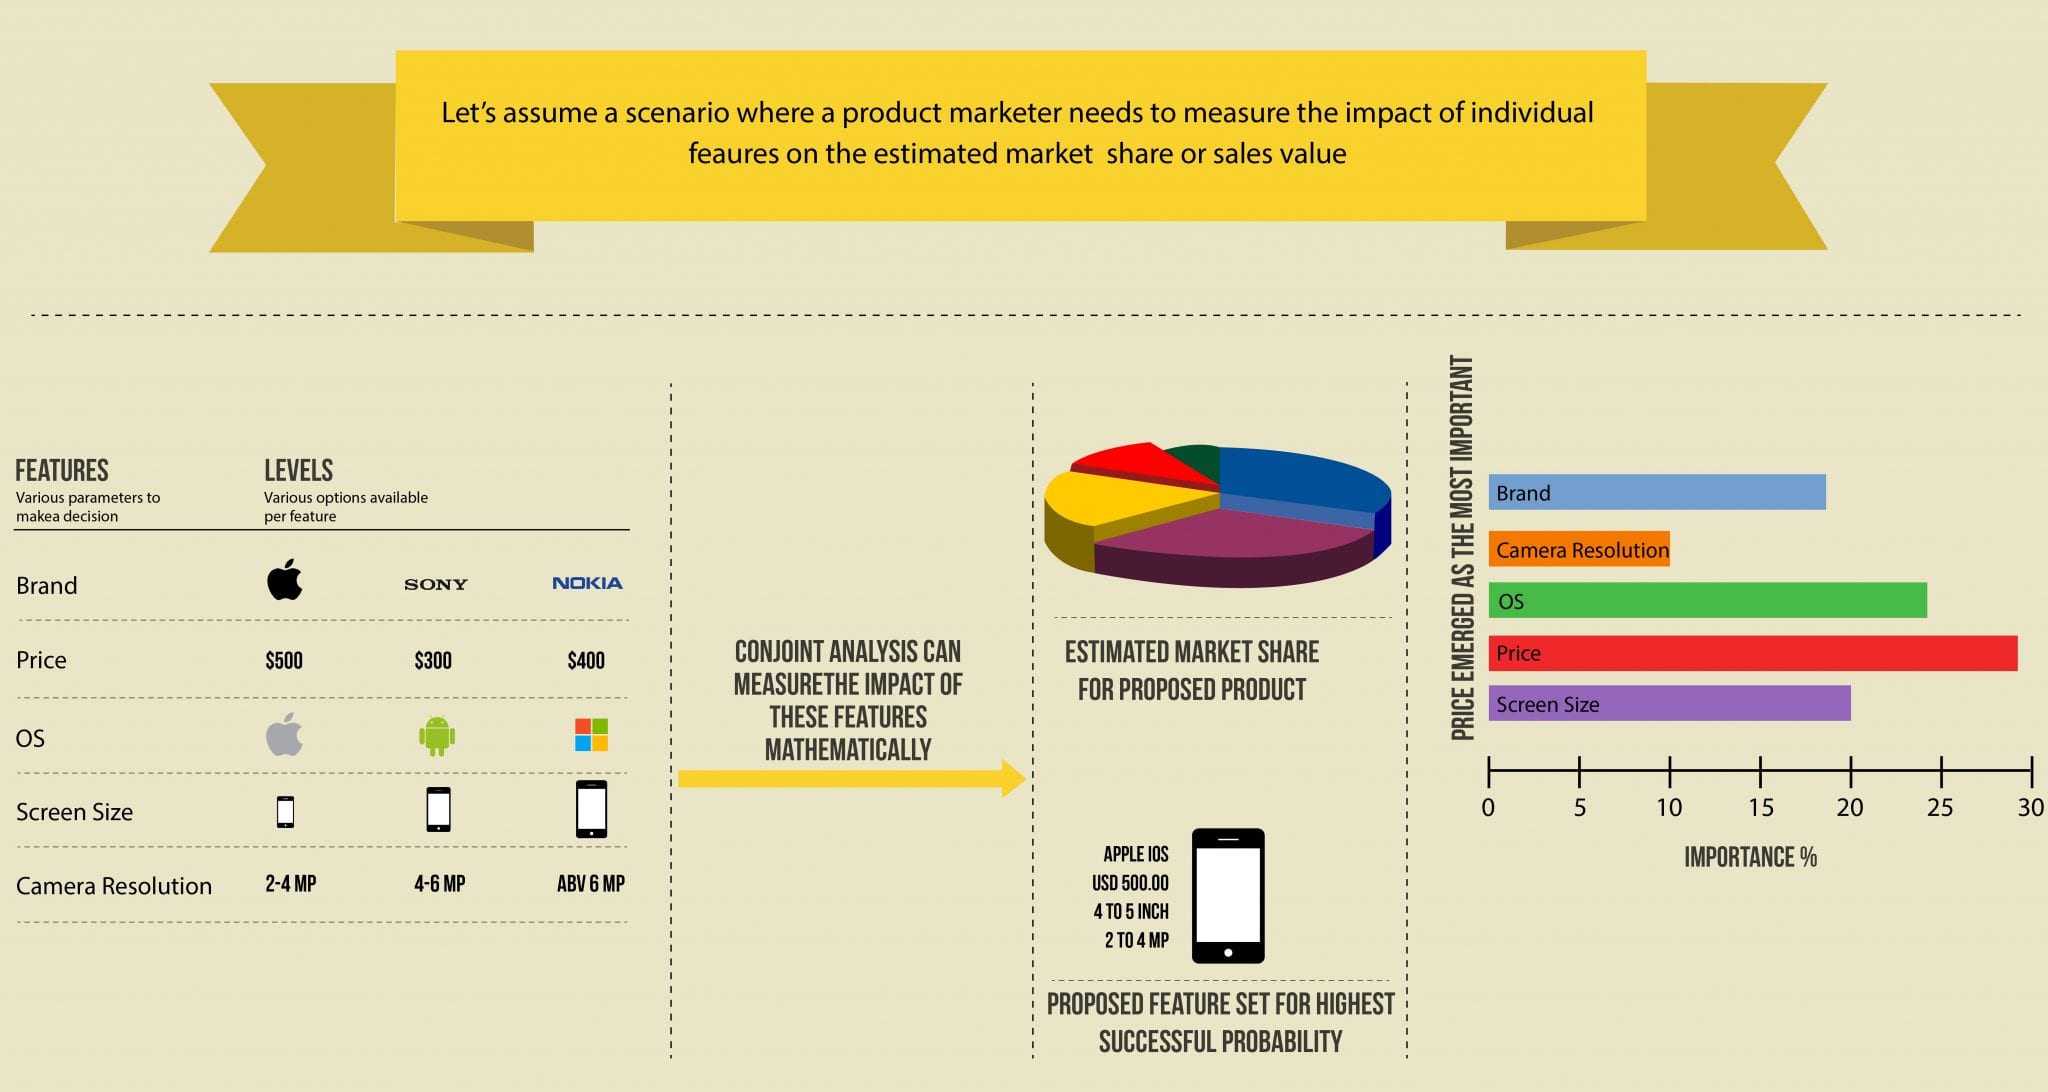
Conjoint analysis is widely used in market research to identify customers’ preference for various attributes that make up a product. The attributes can be various features like size, color, usability, price etc.
Using conjoint (tradeoff) analysis, brand managers can identify which features would customer’s tradeoff for a certain price points. Thus it is highly used technique in new product design or pricing strategies.
8. Neural Networks
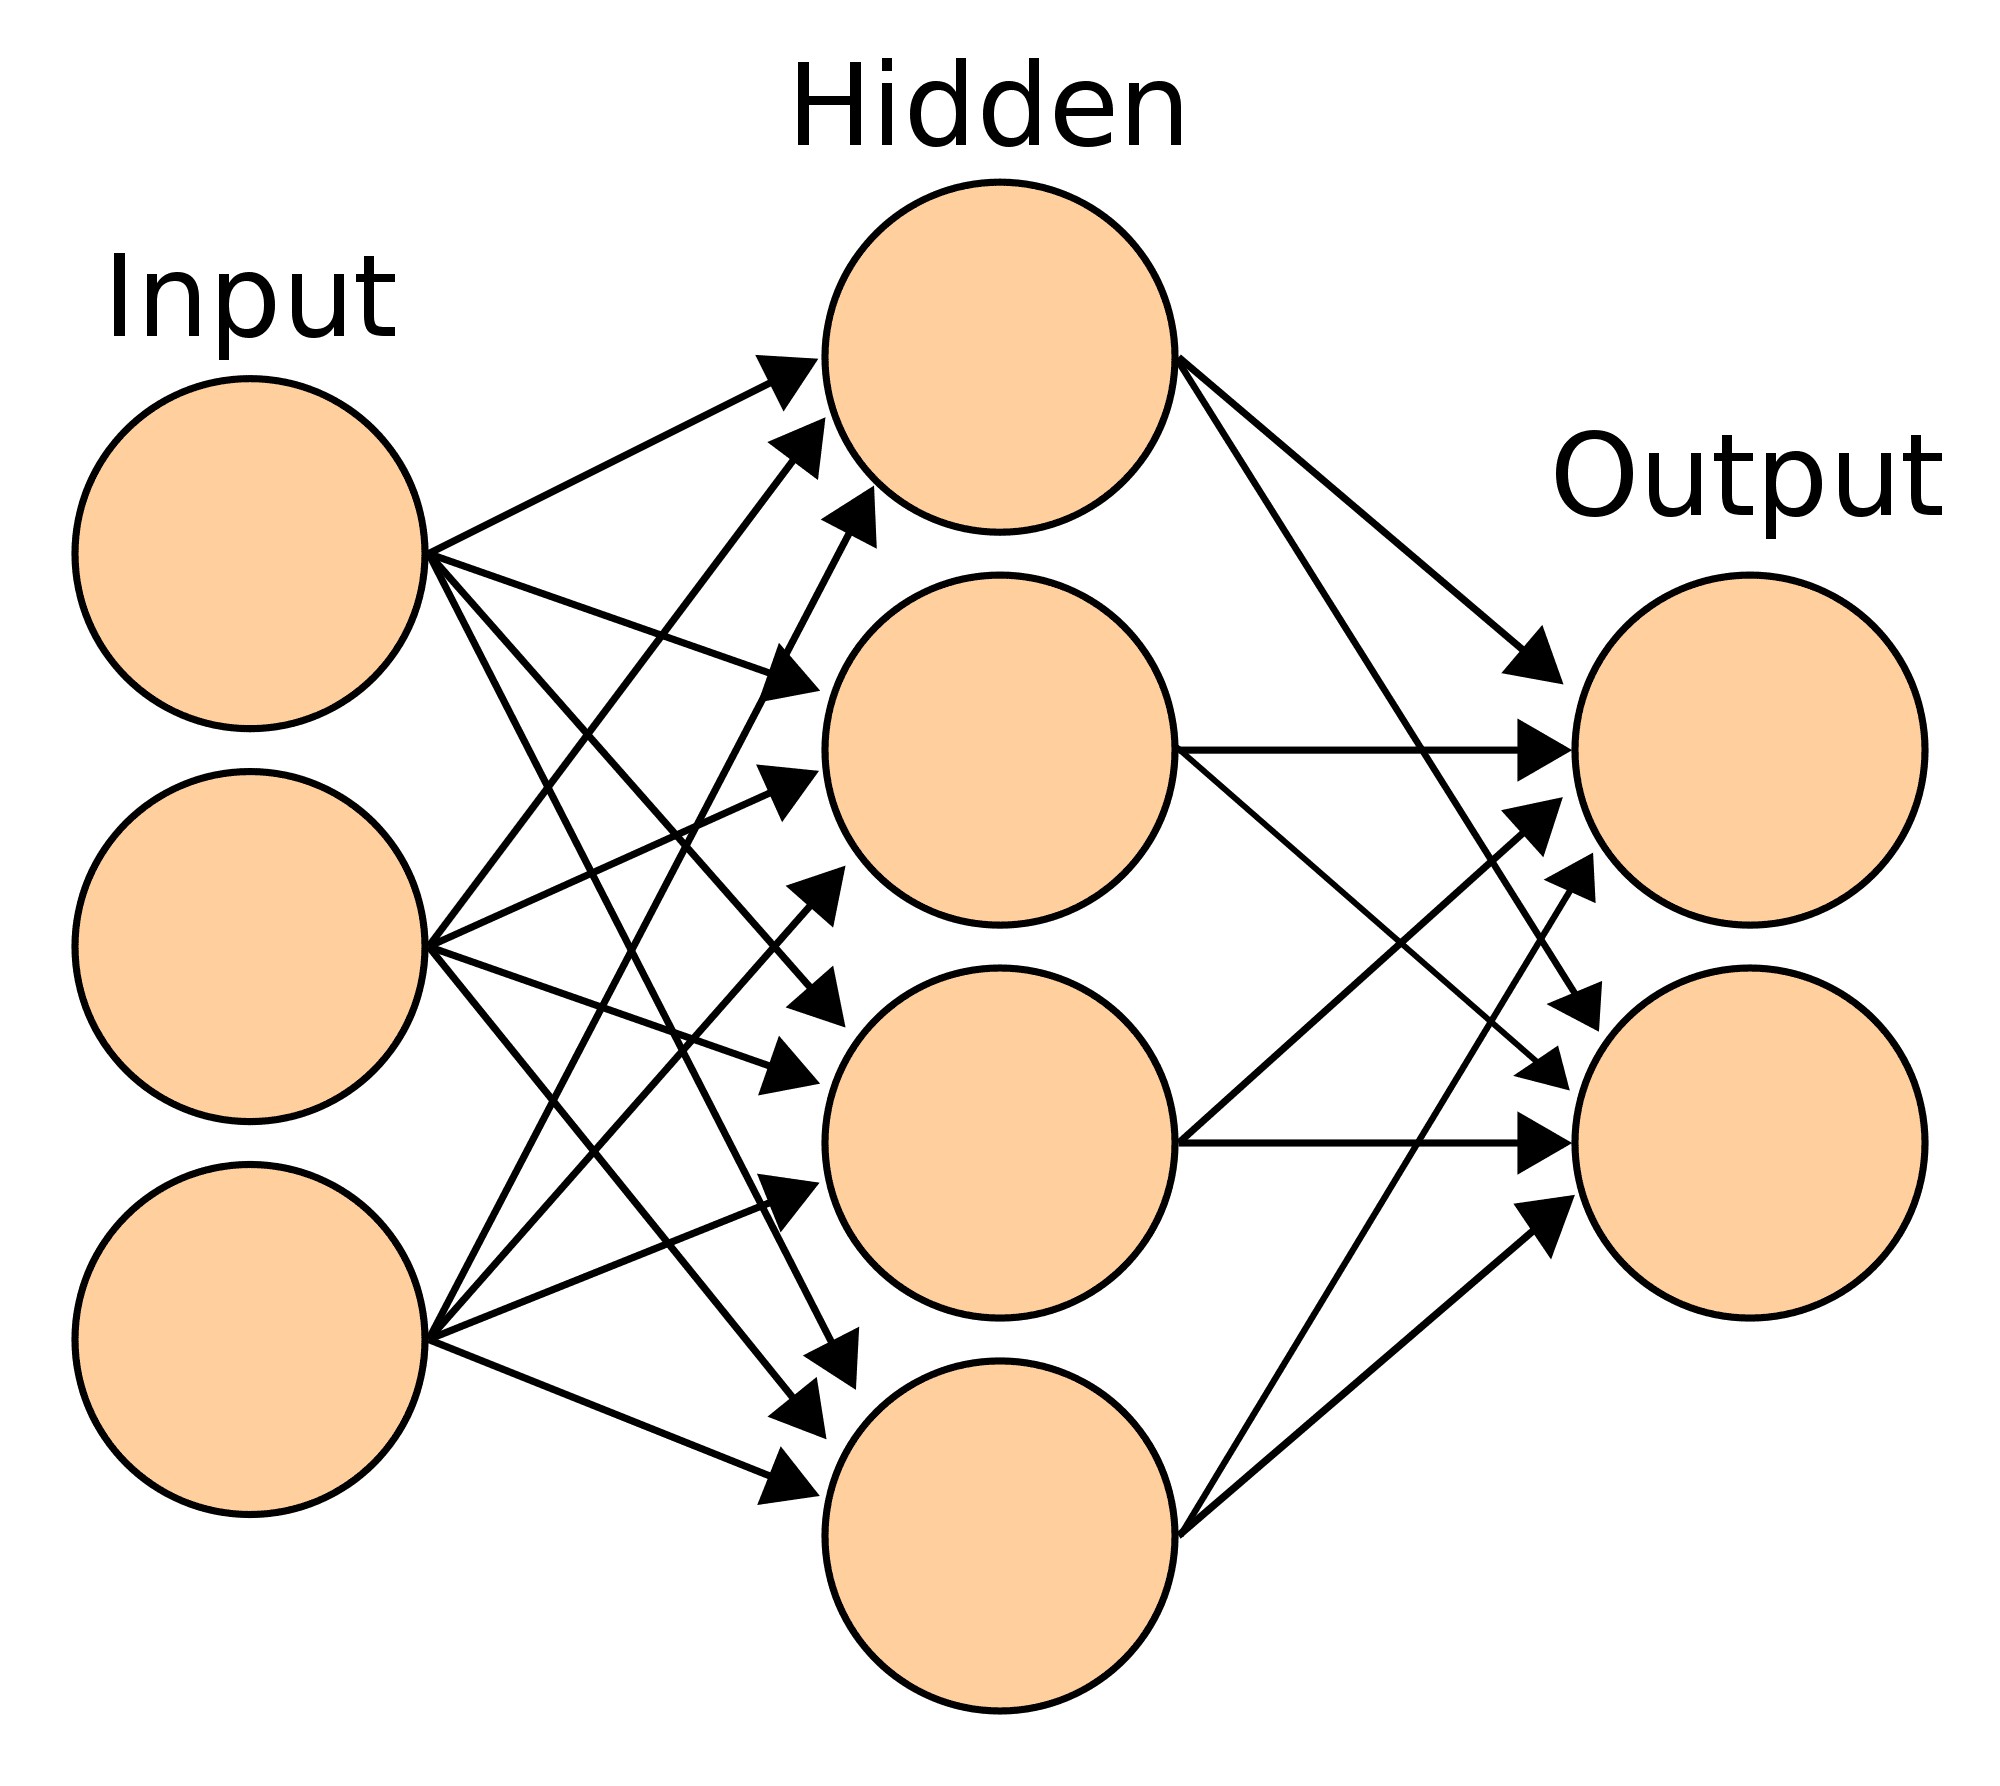
Neural network (also known as Artificial Neural Network) is inspired by human nervous system, how complex information is absorbed and processed by the system. Just like humans, neural networks learn by example and are configured to a specific application.
Neural networks are used to find patterns in complex data and thus provide forecast and classify data points. Neural networks are normally organized in layers. Layers are made up of a number of interconnected ‘nodes’. Patterns are presented to the network via the ‘input layer’, which communicates to one or more ‘hidden layers’ where the actual processing is done. The hidden layers then link to an ‘output layer’ where the answer is output as shown in the graphic below.
9. Decision Trees
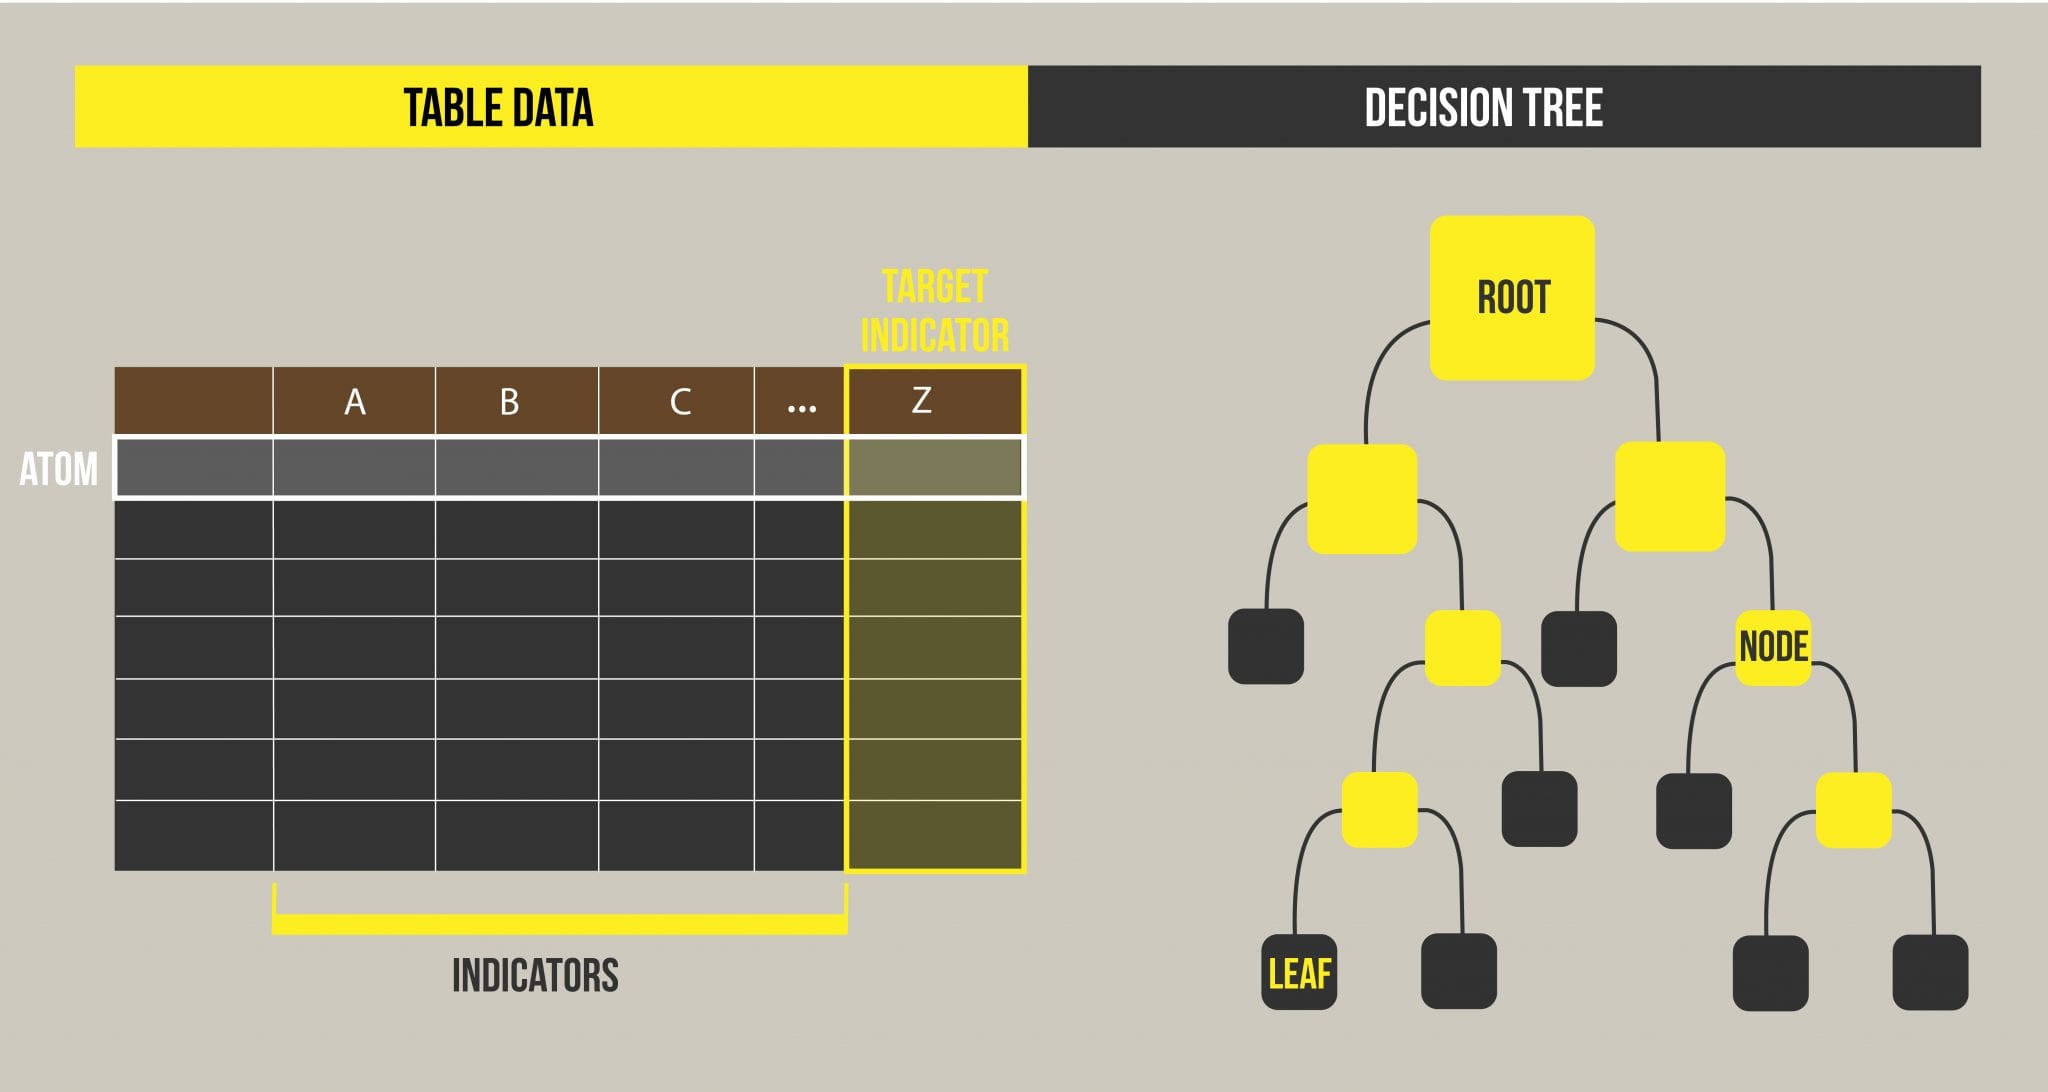
Decision trees, as the name suggest, is a tree-shaped visual representation of one can reach to a particular decision by laying down all options and their probability of occurrence. Decision trees are extremely easy to understand and interpret. At each node of the tree, one can interpret what would be the consequence of selecting that node or option.
10. Ensemble Methods
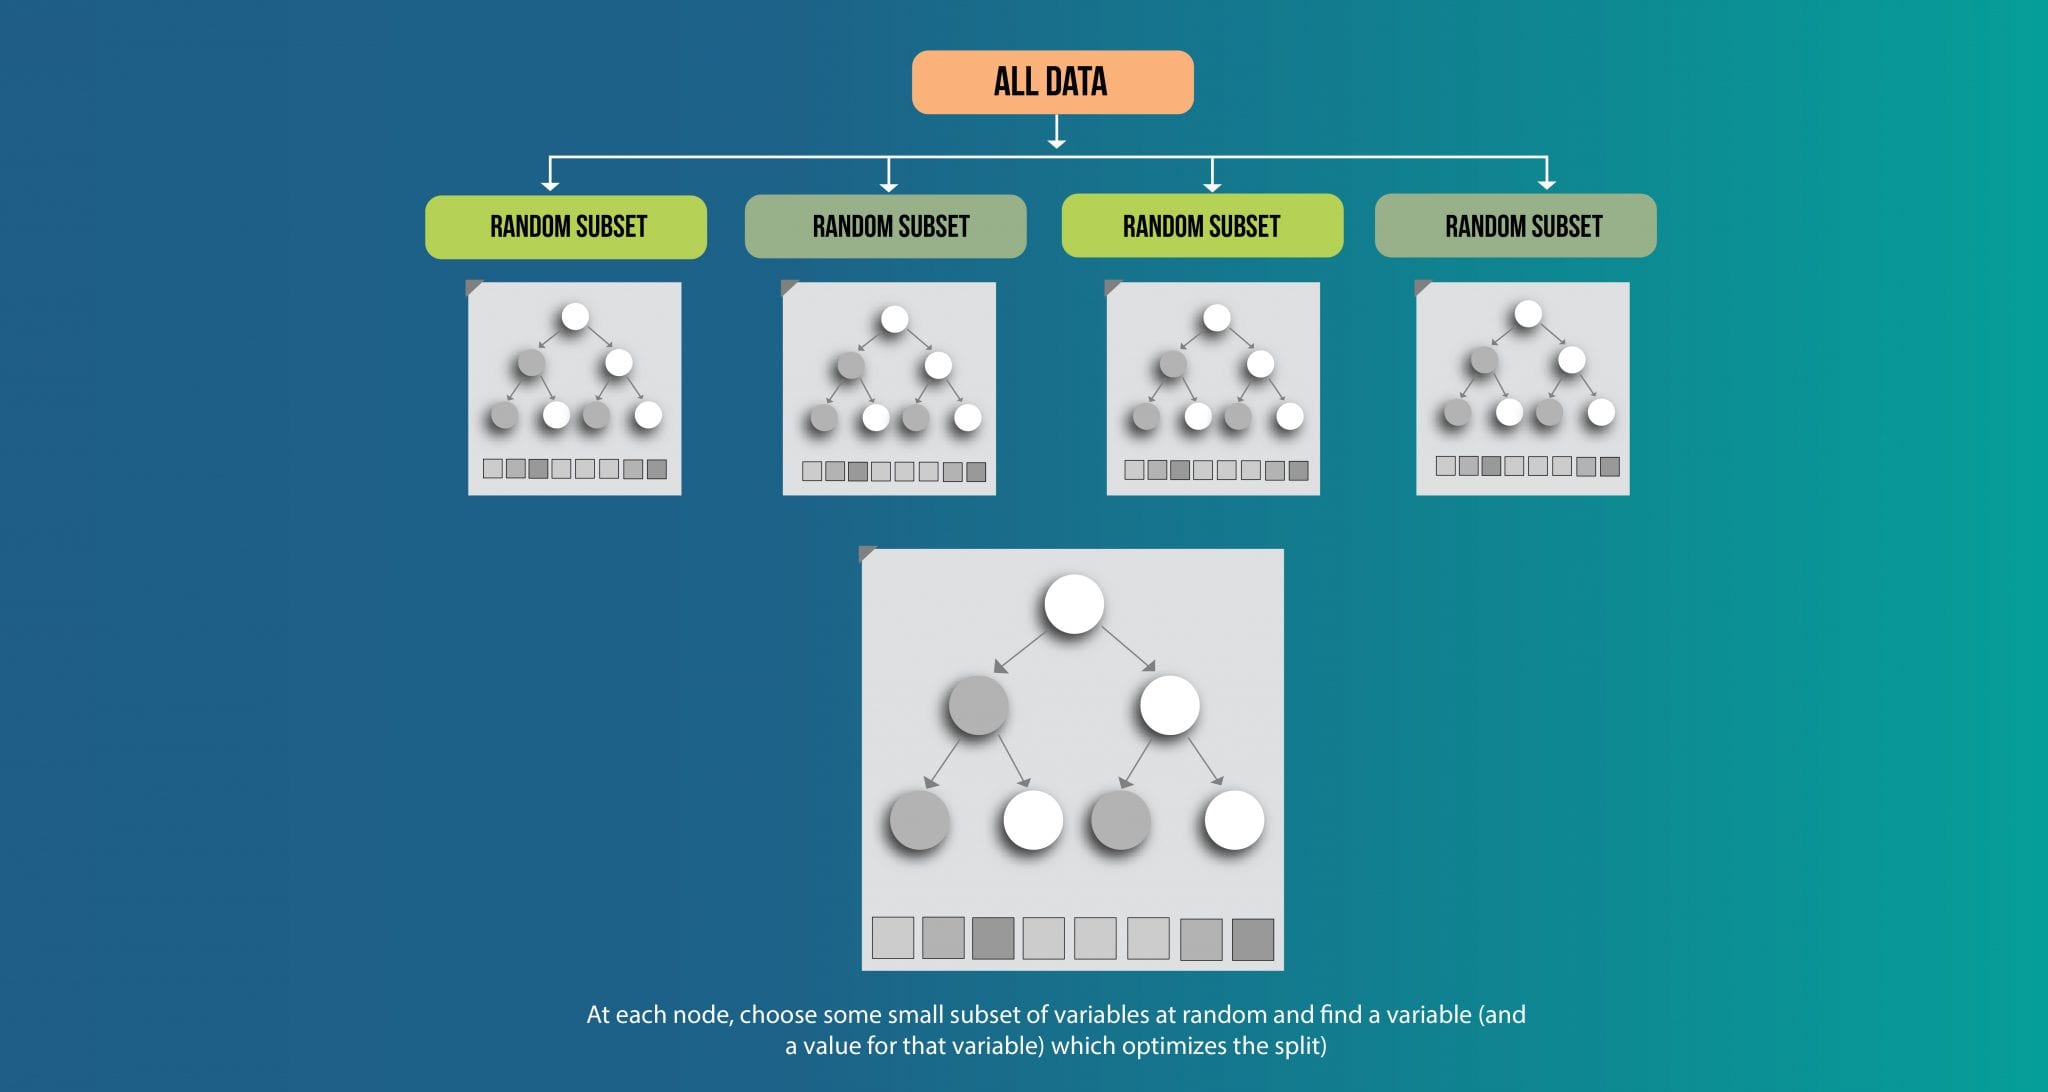
Ensemble methods works on the philosophy that many weak learners can come together to give a strong prediction. Random forest is currently the most accurate of all classification techniques available. Random forest is an ensemble method. In this case, the weak learner is a simple decision tree and random forest is strong learner.
Random forest optimizes the output from many decision trees formed from sample of same dataset. Thus finding the most accurate of classification model.